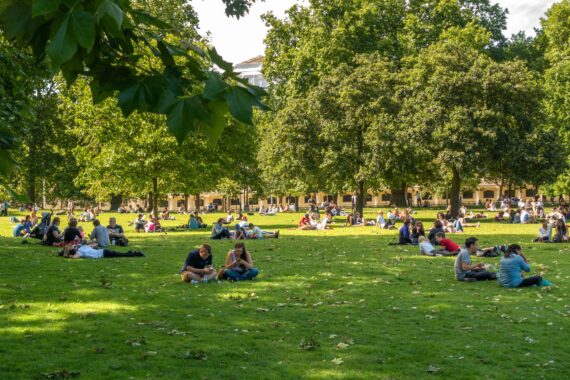
Do you know where the closest park is and can you get there by walking? If the answer is no, you’re not alone. Some 100 million Americans — nearly one-third of us — don’t live within easy walking distance of a park, public recreation area, or greenbelts, according to the Trust for Public Land, a nonprofit conservation and advocacy organization.
Each year for the past decade, the group has released its ParkScore Index, which ranks the 100 biggest U.S. cities’ public park systems based on five criteria: access, investment, amenities, acreage, and equity. As the study’s authors note in the newly released 2021 report, “This past year has proved that parks are not just a nicety — they are a necessity. As Americans endured the health and economic challenges brought on by a global pandemic, the outdoors became a lifeline.”
However, not all cities offer their residents equal access to parks and greenspace, the study finds. Wealthy, white neighborhoods are more likely to have larger parks with more amenities (such as dog parks, basketball courts, restrooms, pools, and so on), better access to those parks (within a 10-minute walk from home), and are more likely to benefit from public investment in greenspace than low-income neighborhoods and communities of color do. In just two of the top 100 cities — Boston and San Francisco — can 100% of residents, regardless of income or ethnicity, walk to a public greenspace within 10 minutes from home.
Here’s a look at the best and worst cities, according to the 2021 report.
Related: The Best and Worst Cities for an Active Lifestyle
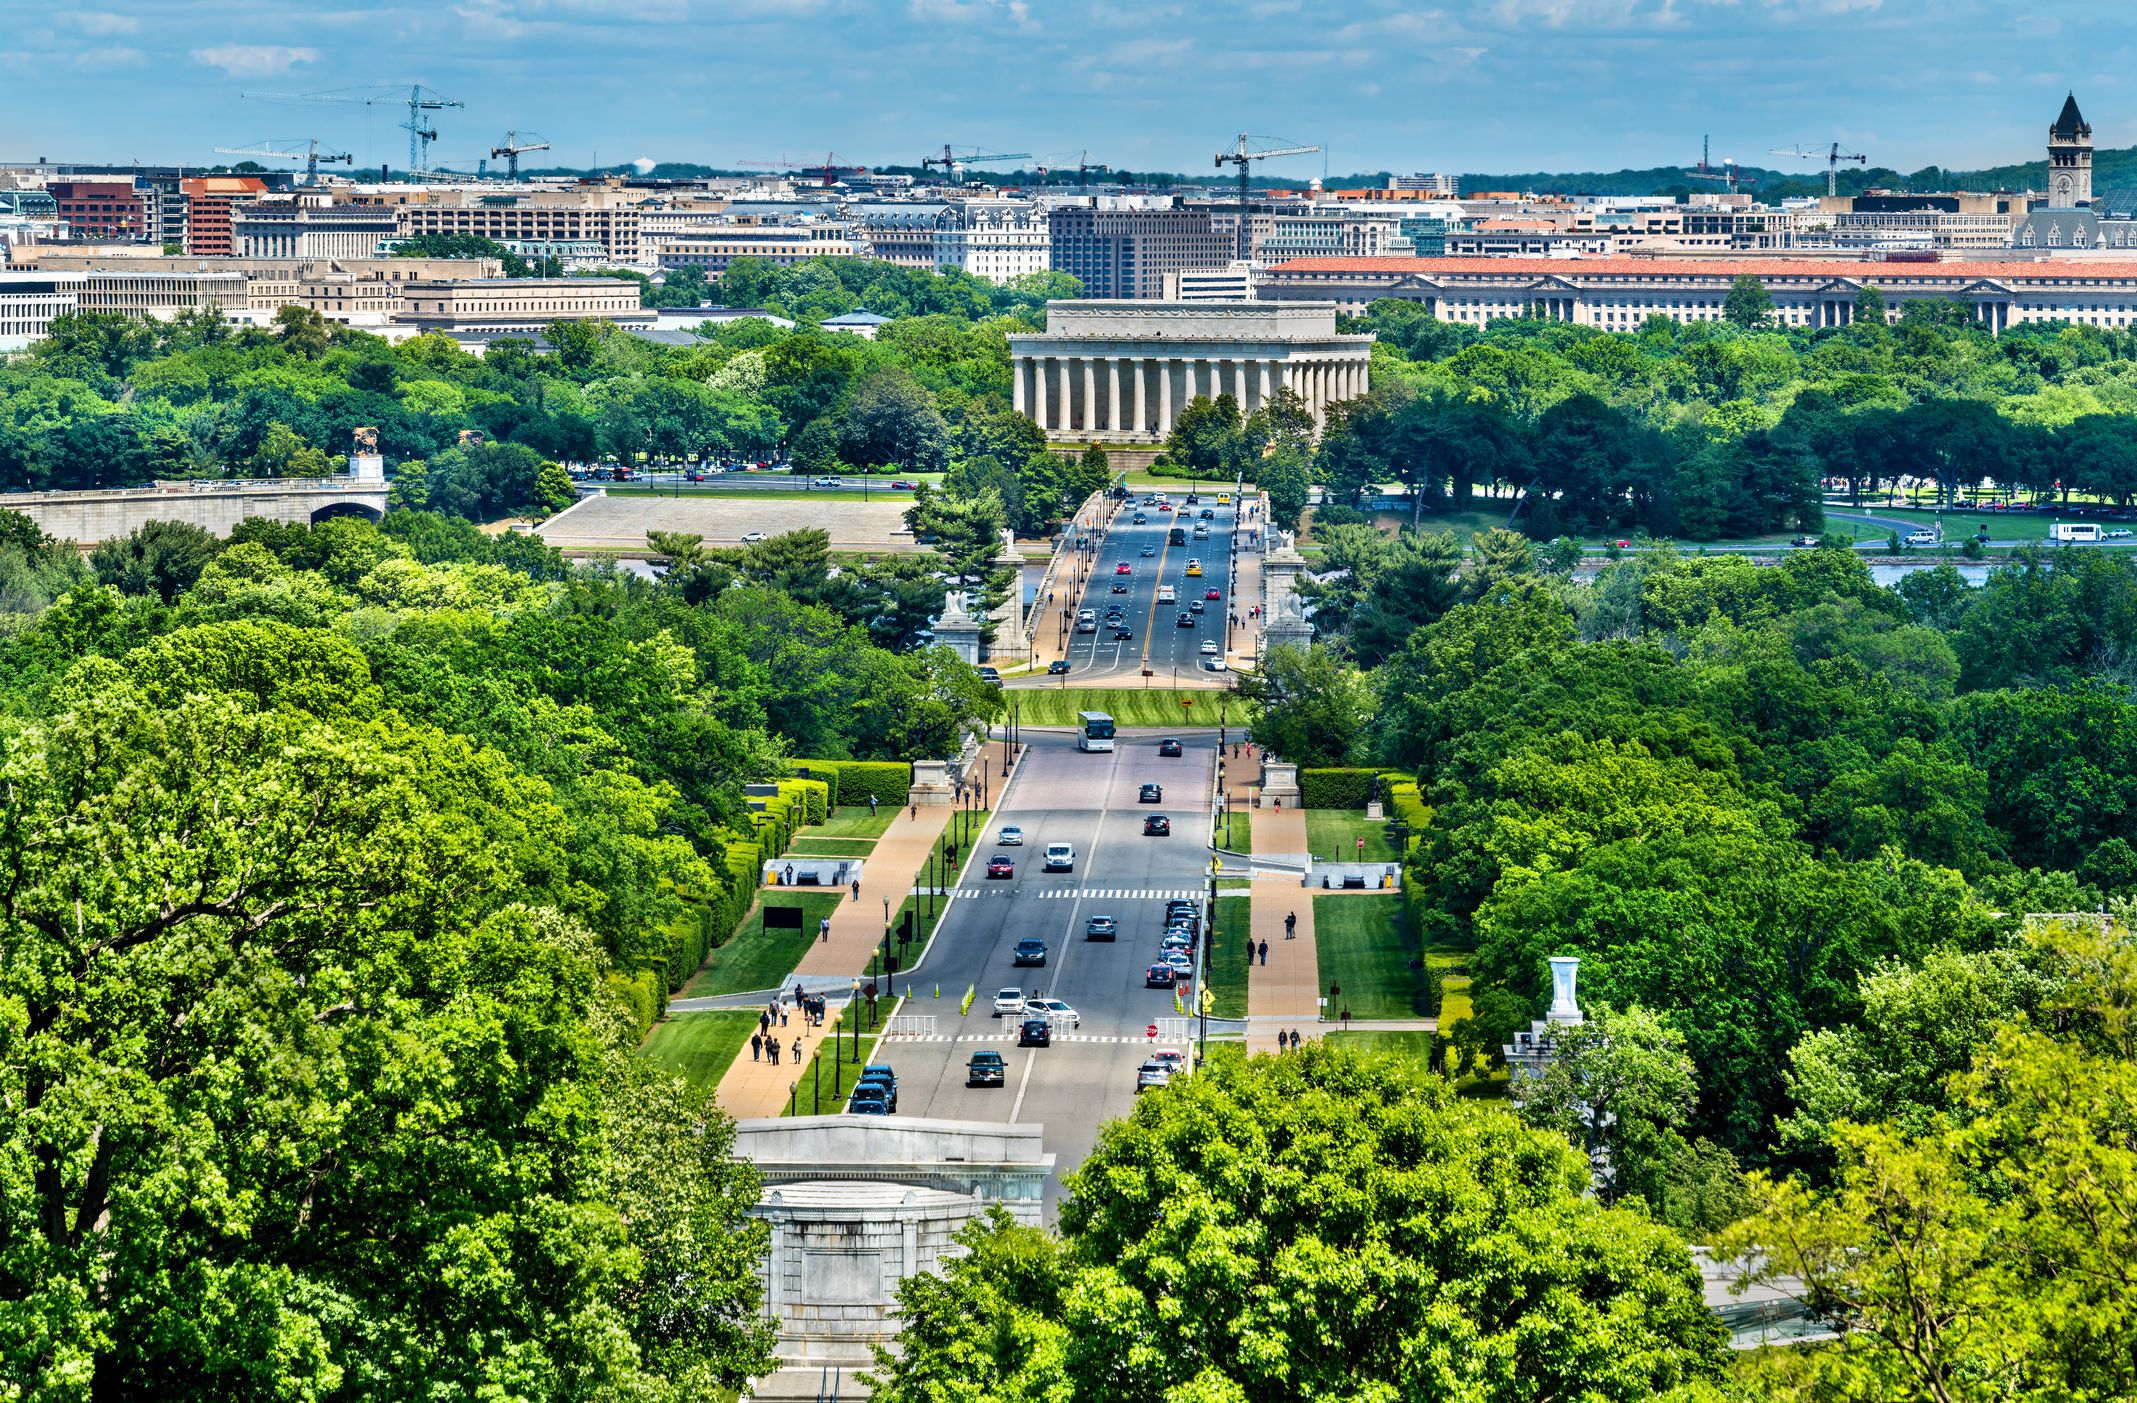
No. 1 Best: Washington, District of Columbia
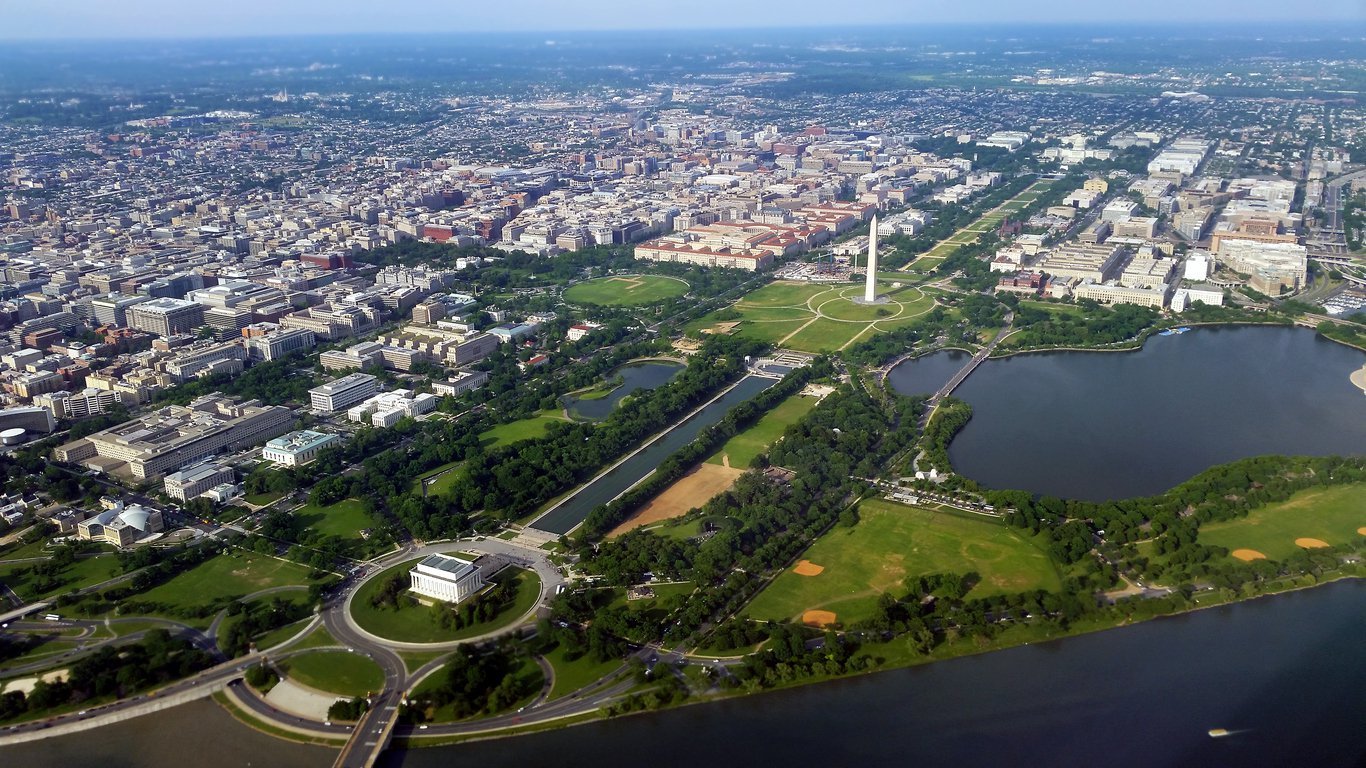
Number of parks: 636
City land devoted to parks and recreation: 21%
Percentage of residents living with a 10-minute walk: 98%
The nation’s capital comes out on top, according to the 2021 ParkScore Index, thanks largely to accessibility, civic investment, and amenities. Equity is also noteworthy, with Washington being one of the few cities where its poorer residents and communities of color have an advantage in terms of park space. Compared to other cities in the report, District parks rank only midpack in terms of acreage. But what those parks may lack in size, they rank highly for in amenities, namely senior centers, basketball hoops, dog parks, and splash pads. Per-capita spending on parks is $286, far exceeding the national average of $96.
Related: 24 Free or Cheap Things to Do in Washington, D.C.
No. 2 Best: St. Paul, Minnesota

Number of parks: 264
City land devoted to parks and recreation: 16%
Percentage of residents living with a 10-minute walk: 99%
Parks in St. Paul, Minnesota’s capital city, rank at or close to the 90th percentile for amenities such as senior centers, recreation centers, basketball courts, and public restrooms. Public and private spending on parks is also at the top of the rankings, but St. Paul’s minority communities do not enjoy the same equitable access that their counterparts in Washington, D.C., do. Access to park space for communities of color is 30% less than for white residents, according to the study, while low-income neighborhoods have 35% less park space than wealthier areas.
Related: The Coldest and Warmest Cities in Every State
No. 3 Best: Minneapolis

Number of parks: 272
City land devoted to parks and recreation: 10%
Percentage of residents living with a 10-minute walk: 98%
The larger of the Twin Cities, Minneapolis finishes just below St. Paul in terms of overall ParkScore ranking. Civic investment in public space is at the top of the rankings, and the city scores in the 99th percentile for access to recreation and senior centers. Like St. Paul, however, poorer residents of Minneapolis and communities of color enjoy less than half the park space that their wealthy and white neighbors do.
For more informative lifestyle stories like this, please sign up for our free newsletters.
No. 4 Best: Arlington, Virginia
Number of parks: 183
City land devoted to parks and recreation: 10%
Percentage of residents living with a 10-minute walk: 99%
Parks in this suburb of Washington, D.C., are smaller than those in most cities in the survey, but they contain well-funded amenities for residents. Arlington ranks in the 98th percentile for basketball hoops and playgrounds, while the city is in the 93rd percentile when it comes to dog parks. Communities of color, however, have 34% less park space than white neighborhoods, and the disparity is similar between high- and low-income areas.
Related: Awe-Inspiring Memorials and Other Places Honoring Our Vets
No. 5 Best: Chicago
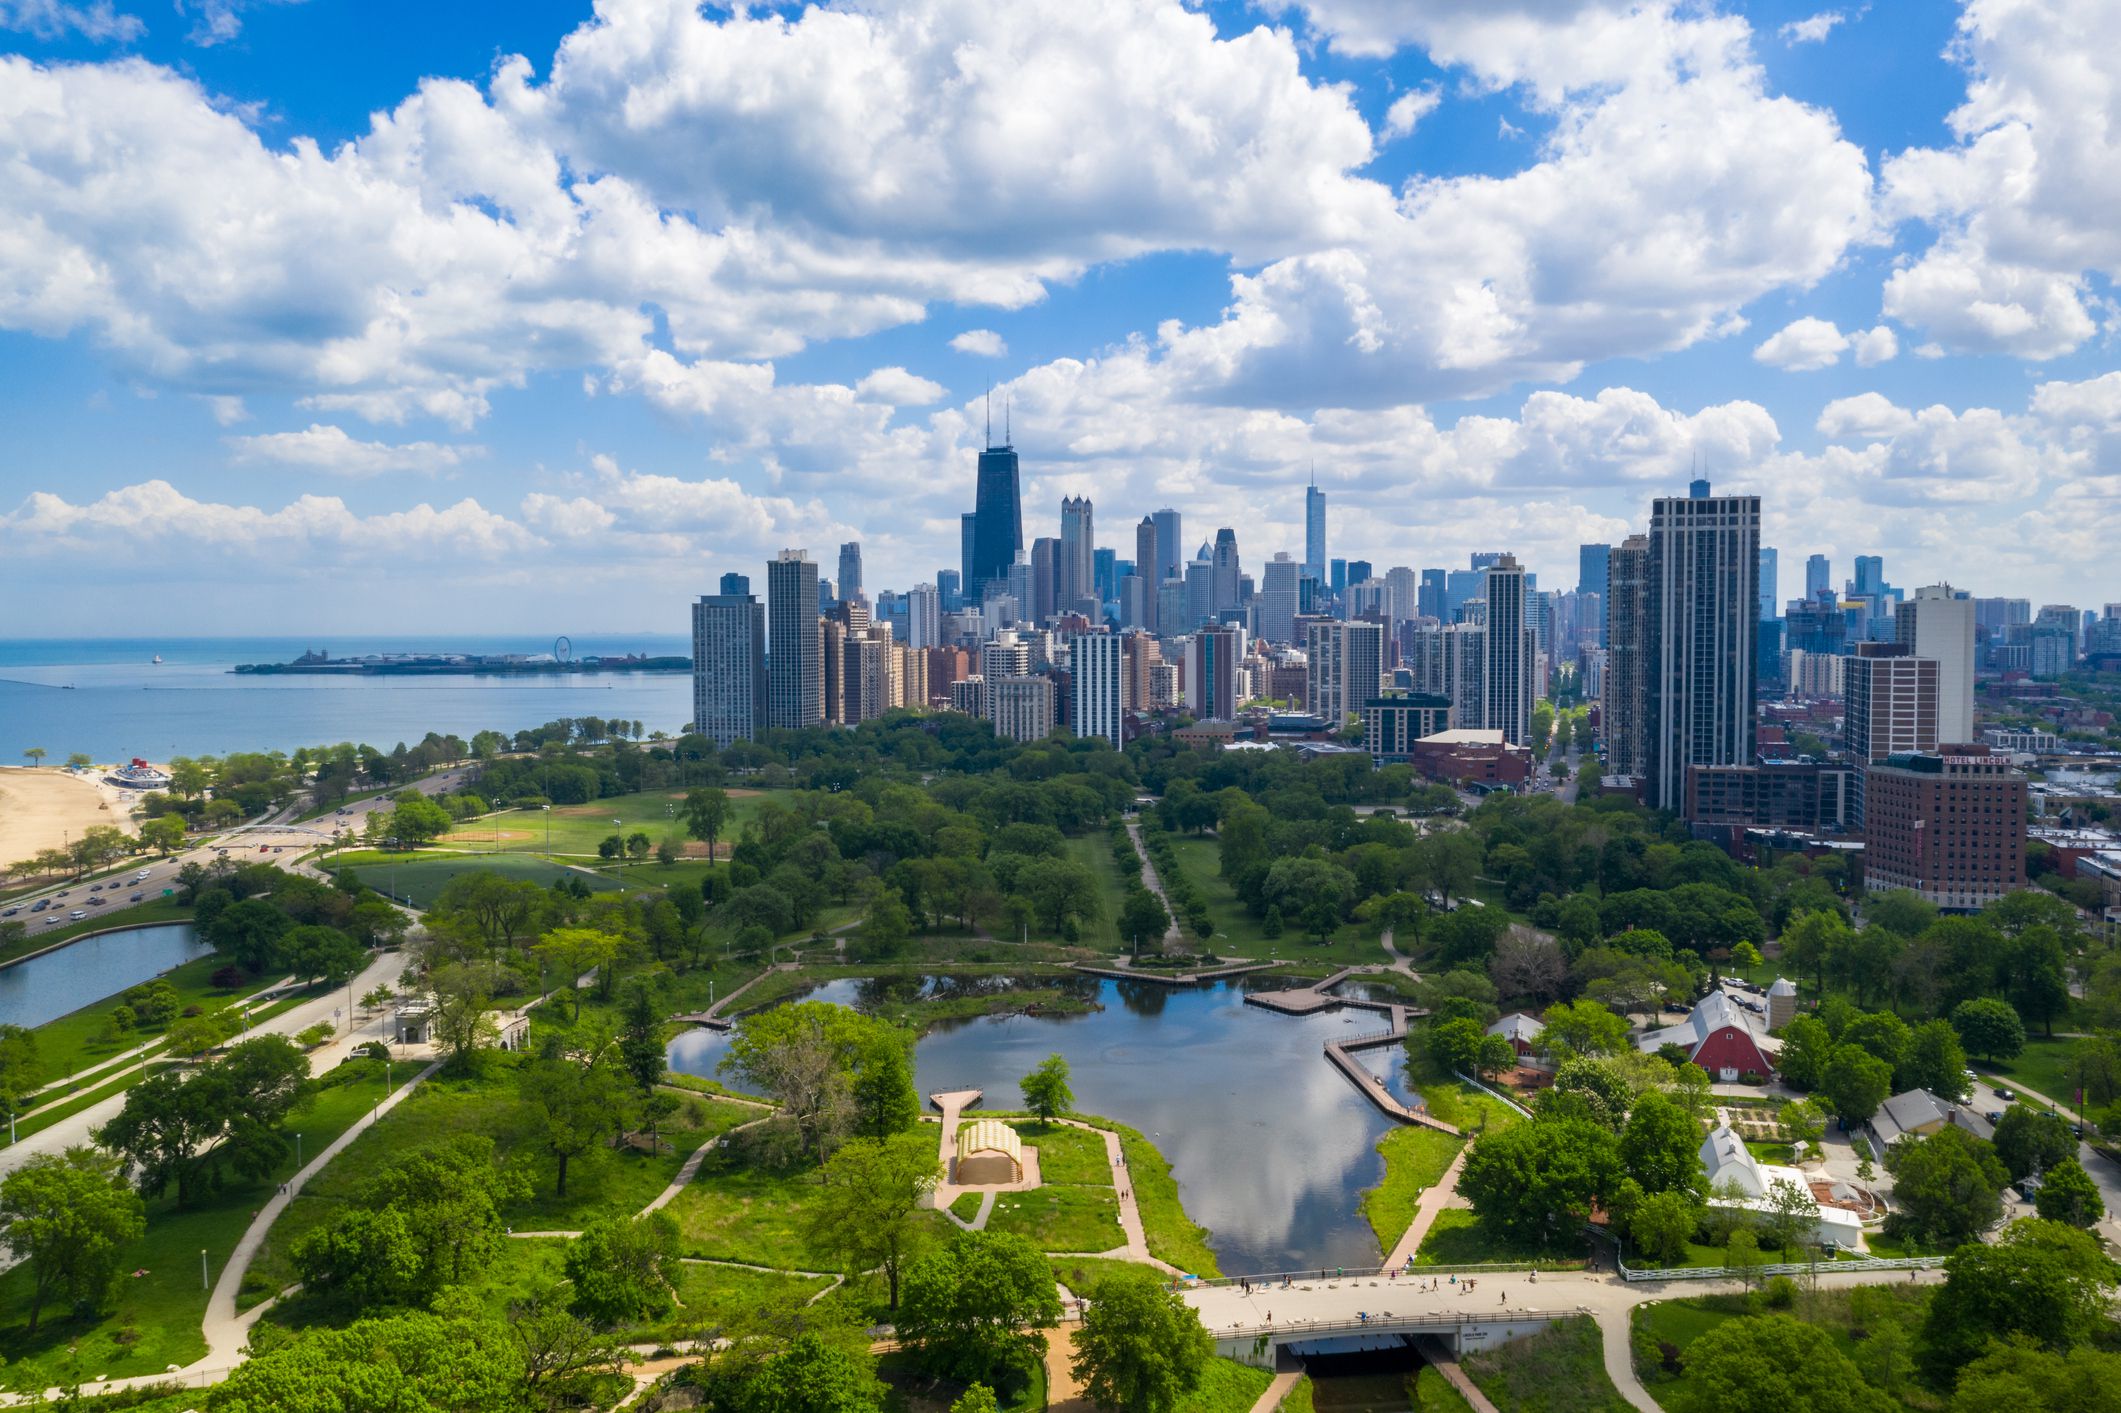
Number of parks: 1,232
City land devoted to parks and recreation: 9%
Percentage of residents living with a 10-minute walk: 98%
Chicago’s many parks are relatively well dispersed throughout the city, giving it high marks for both access and equity, although it lags other top-ranked cities in this list when it comes to park amenities. Case in point, Chicago ranks in the 97th percentile when it comes to splash pads, but it’s only in the 42nd percentile for dog parks. Communities of color and lower-income areas of the city do enjoy an advantage in terms of access to park space, unlike other top-ranked cities in the study.
Related: Best Hot Dog Stands Across America
Trending on Cheapism

No. 1 Worst: Oklahoma City
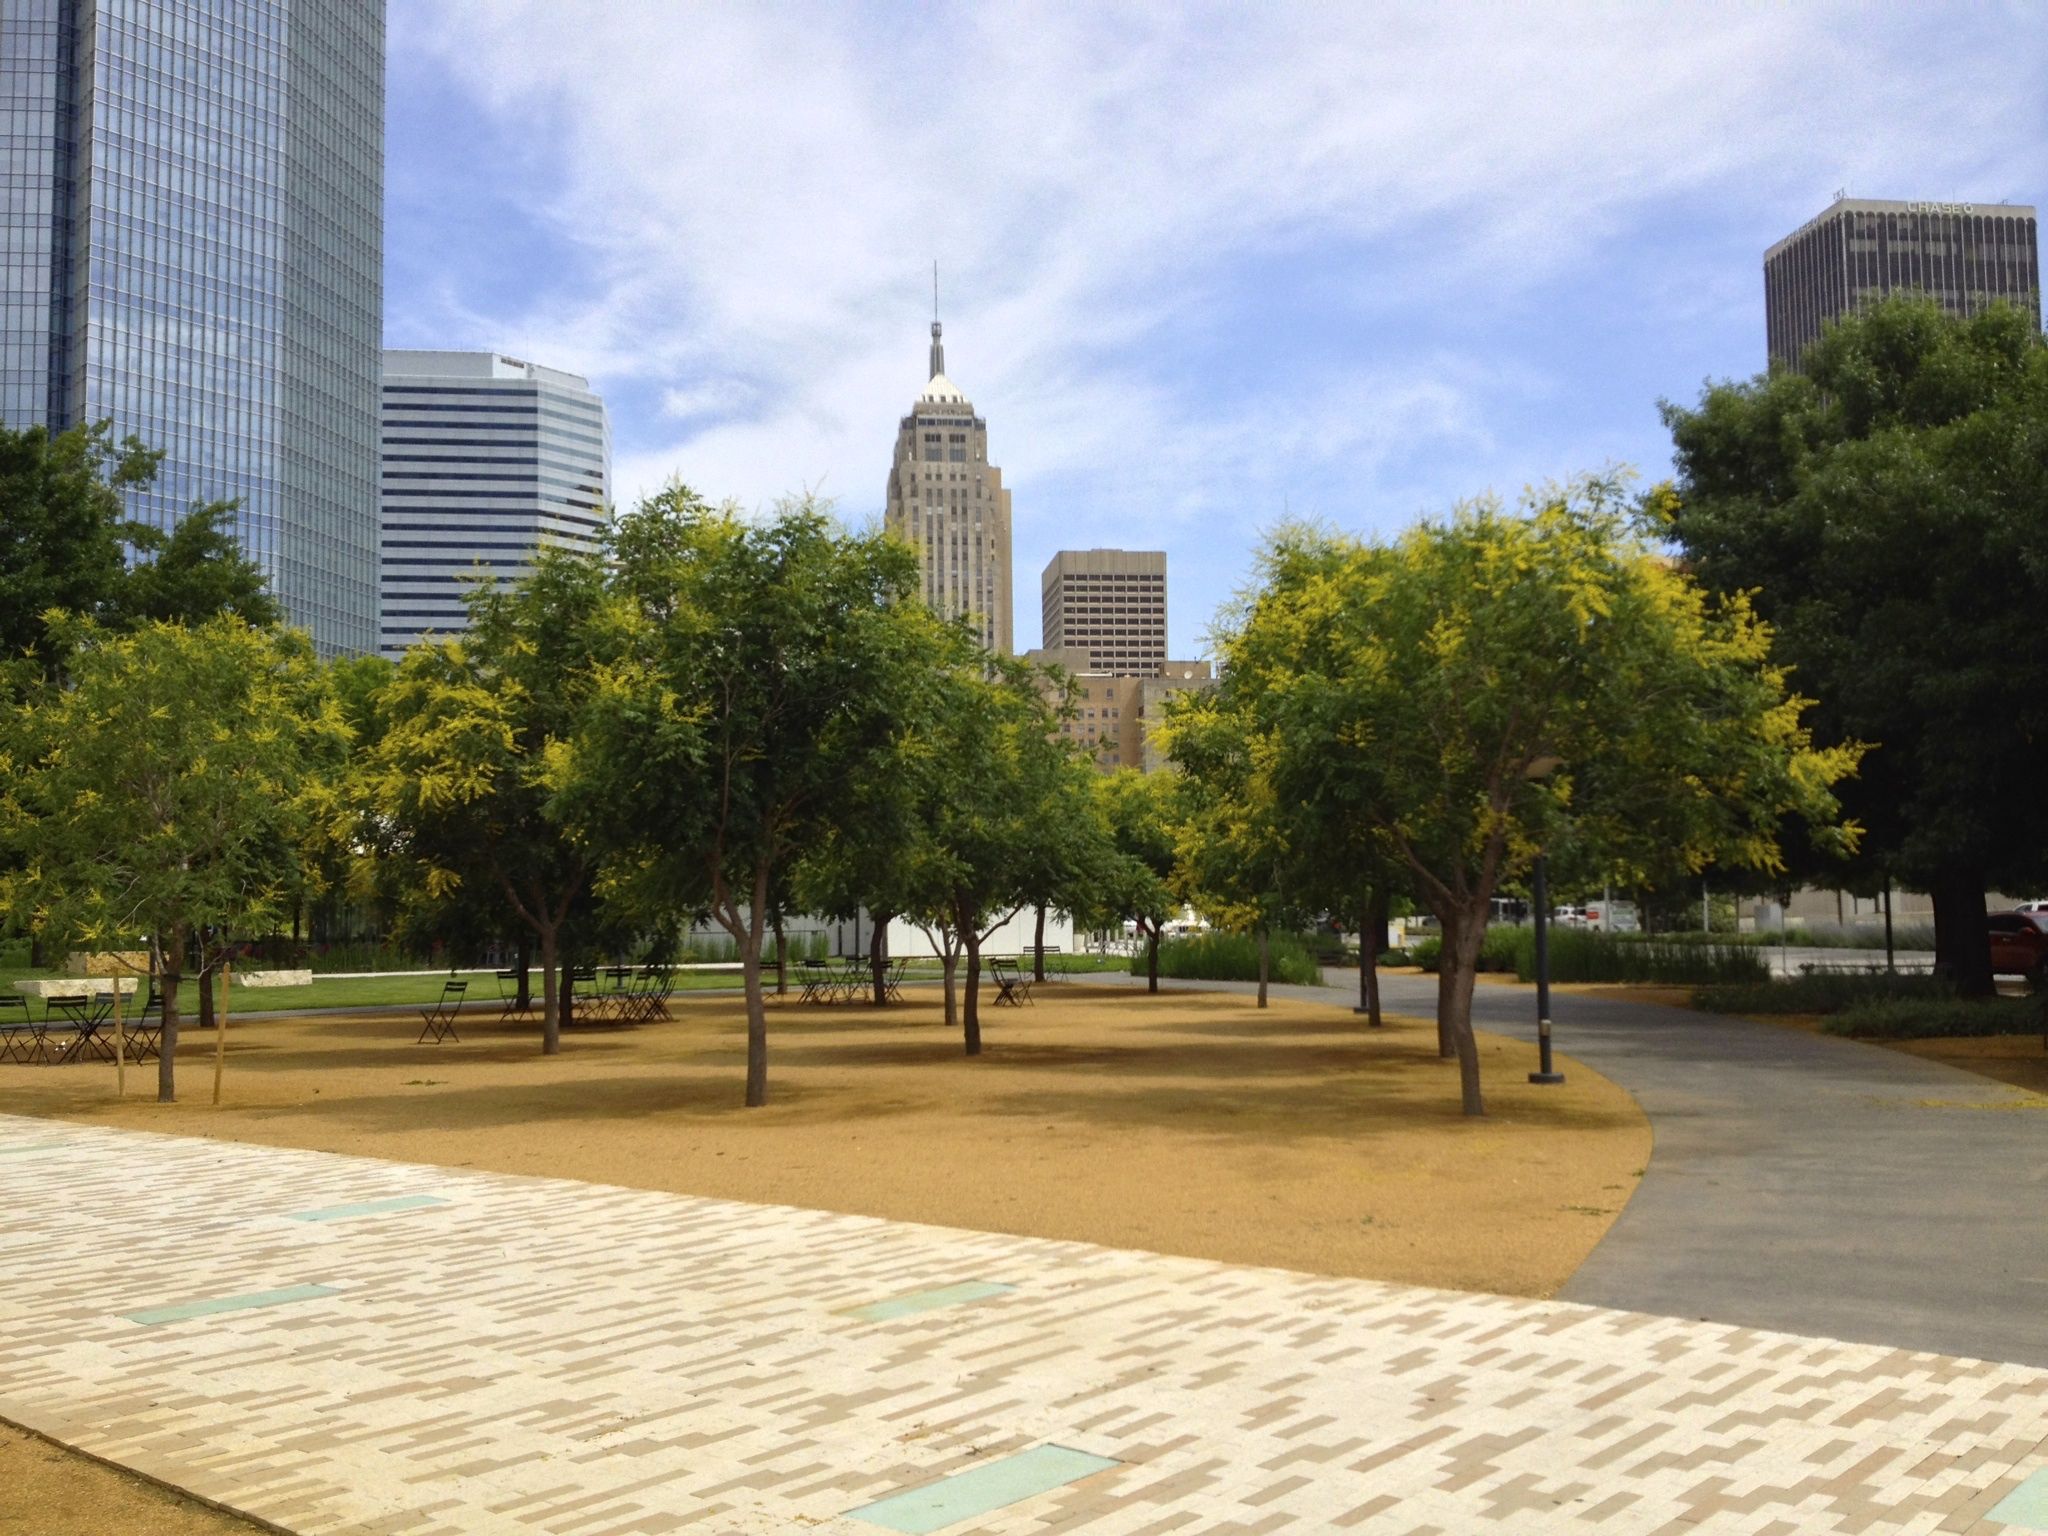
Number of parks: 215
City land devoted to parks and recreation: 2%
Percentage of residents living with a 10-minute walk: 38%
At the bottom end of the ParkScore spectrum is Oklahoma’s capital city, which spends just $65 per person on its parks. Unlike some urban areas, Oklahoma City’s communities of color and lower-income residents actually enjoy slightly more access to park space than their wealthy, white neighbors. But amenities are sorely lacking when compared to other cities in the survey, especially basketball courts, playgrounds, and dog parks.
Related: The 25 Best Cities to Visit With Your Dog
No. 2 Worst (tie): Fresno, California

Number of parks: 263
City land devoted to parks and recreation: 5%
Percentage of residents living with a 10-minute walk: 67%
Fresno spends even less per person on its parks than Oklahoma City (just $42), and it ranks in the lower third among the 100 biggest cities when it comes to amenities like recreation centers, playgrounds, and public restroom facilities.
Related: Most Overweight & Obese States in America
No. 2 Worst (tie): Irving, Texas
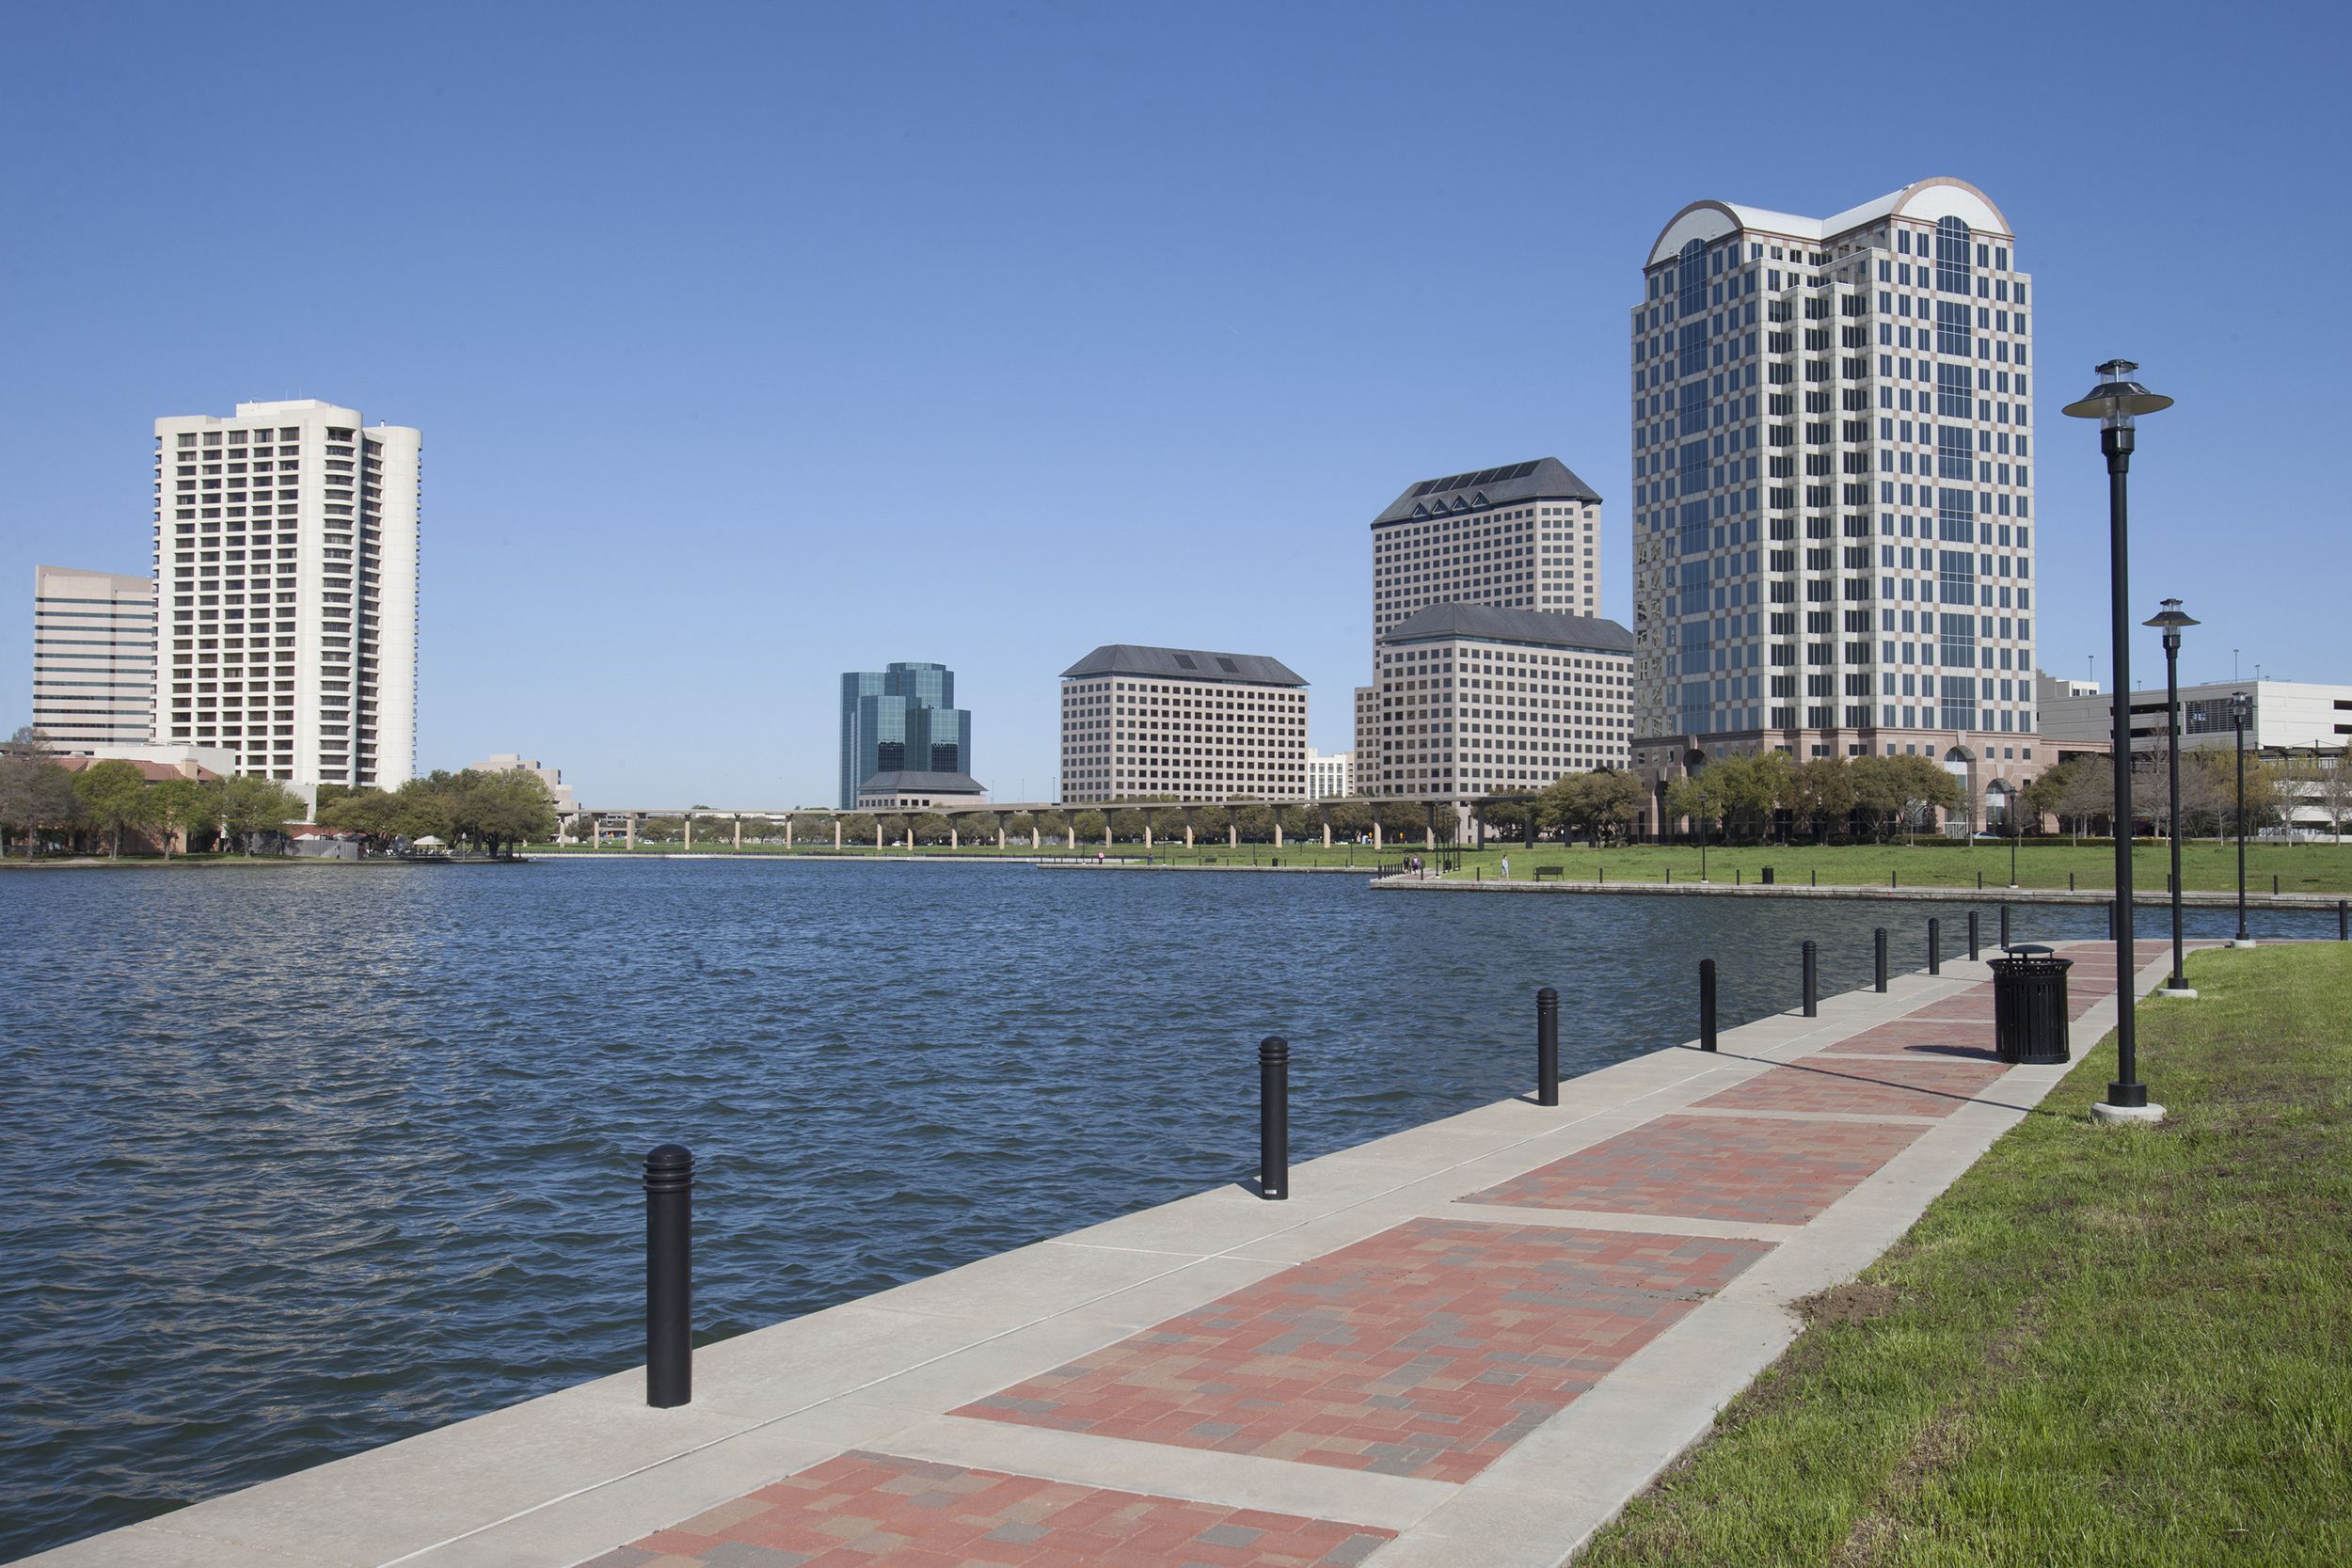
Number of parks: 103
City land devoted to parks and recreation: 5%
Percentage of residents living with a 10-minute walk: 63%
Irving’s poorer, nonwhite residents have access to only about half as much park space as the city’s white residents and higher-income neighborhoods. Irving ranks near the bottom of the survey for amenities such as basketball courts (3rd percentile) and public restrooms (5th percentile). Even for playgrounds, the most common park amenity in Irving, the city ranks only in the 58th percentile among cities in the survey.
Related: 25 Cities With the Most Working Seniors
Sign up for our newsletter
No. 4 Worst: Mesa, Arizona
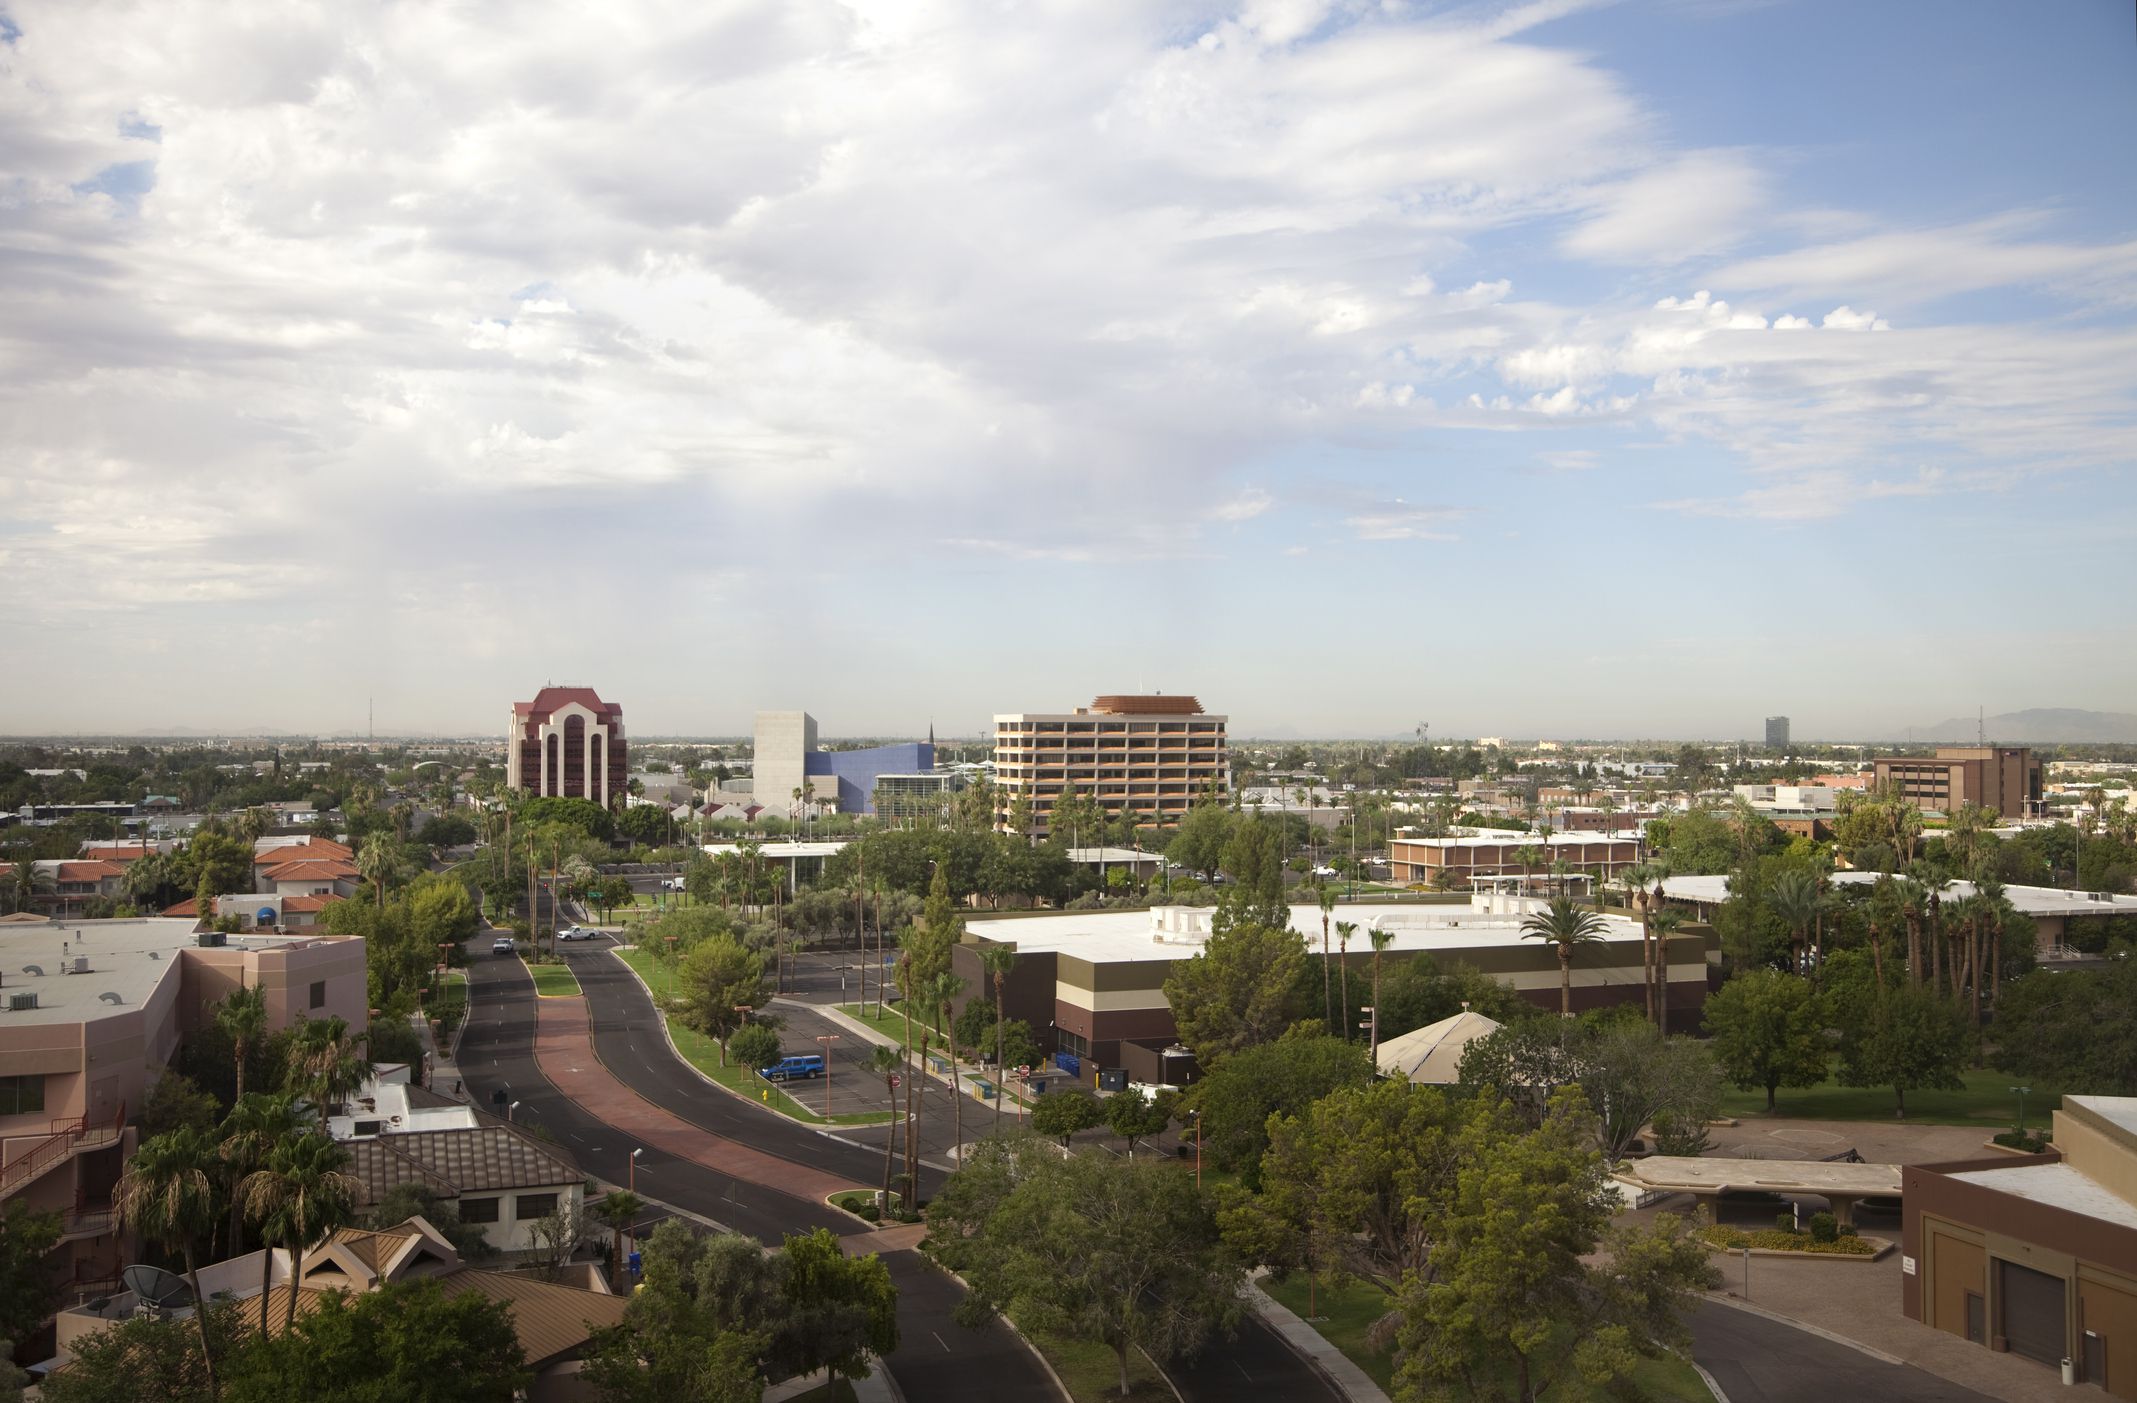
Number of parks: 288
City land devoted to parks and recreation: 2%
Percentage of residents living with a 10-minute walk: 66%
Senior centers and recreation facilities are particularly lacking in Mesa, which dwells near the bottom in the 2nd percentile for this public amenity. The city is also near the bottom for things like playgrounds, dog parks, and public restrooms, too. Poorer residents have 32% less park space than wealthier areas.
Related: The Dirtiest (and Cleanest) Big Cities in America
No. 5 Worst: Memphis, Tennessee
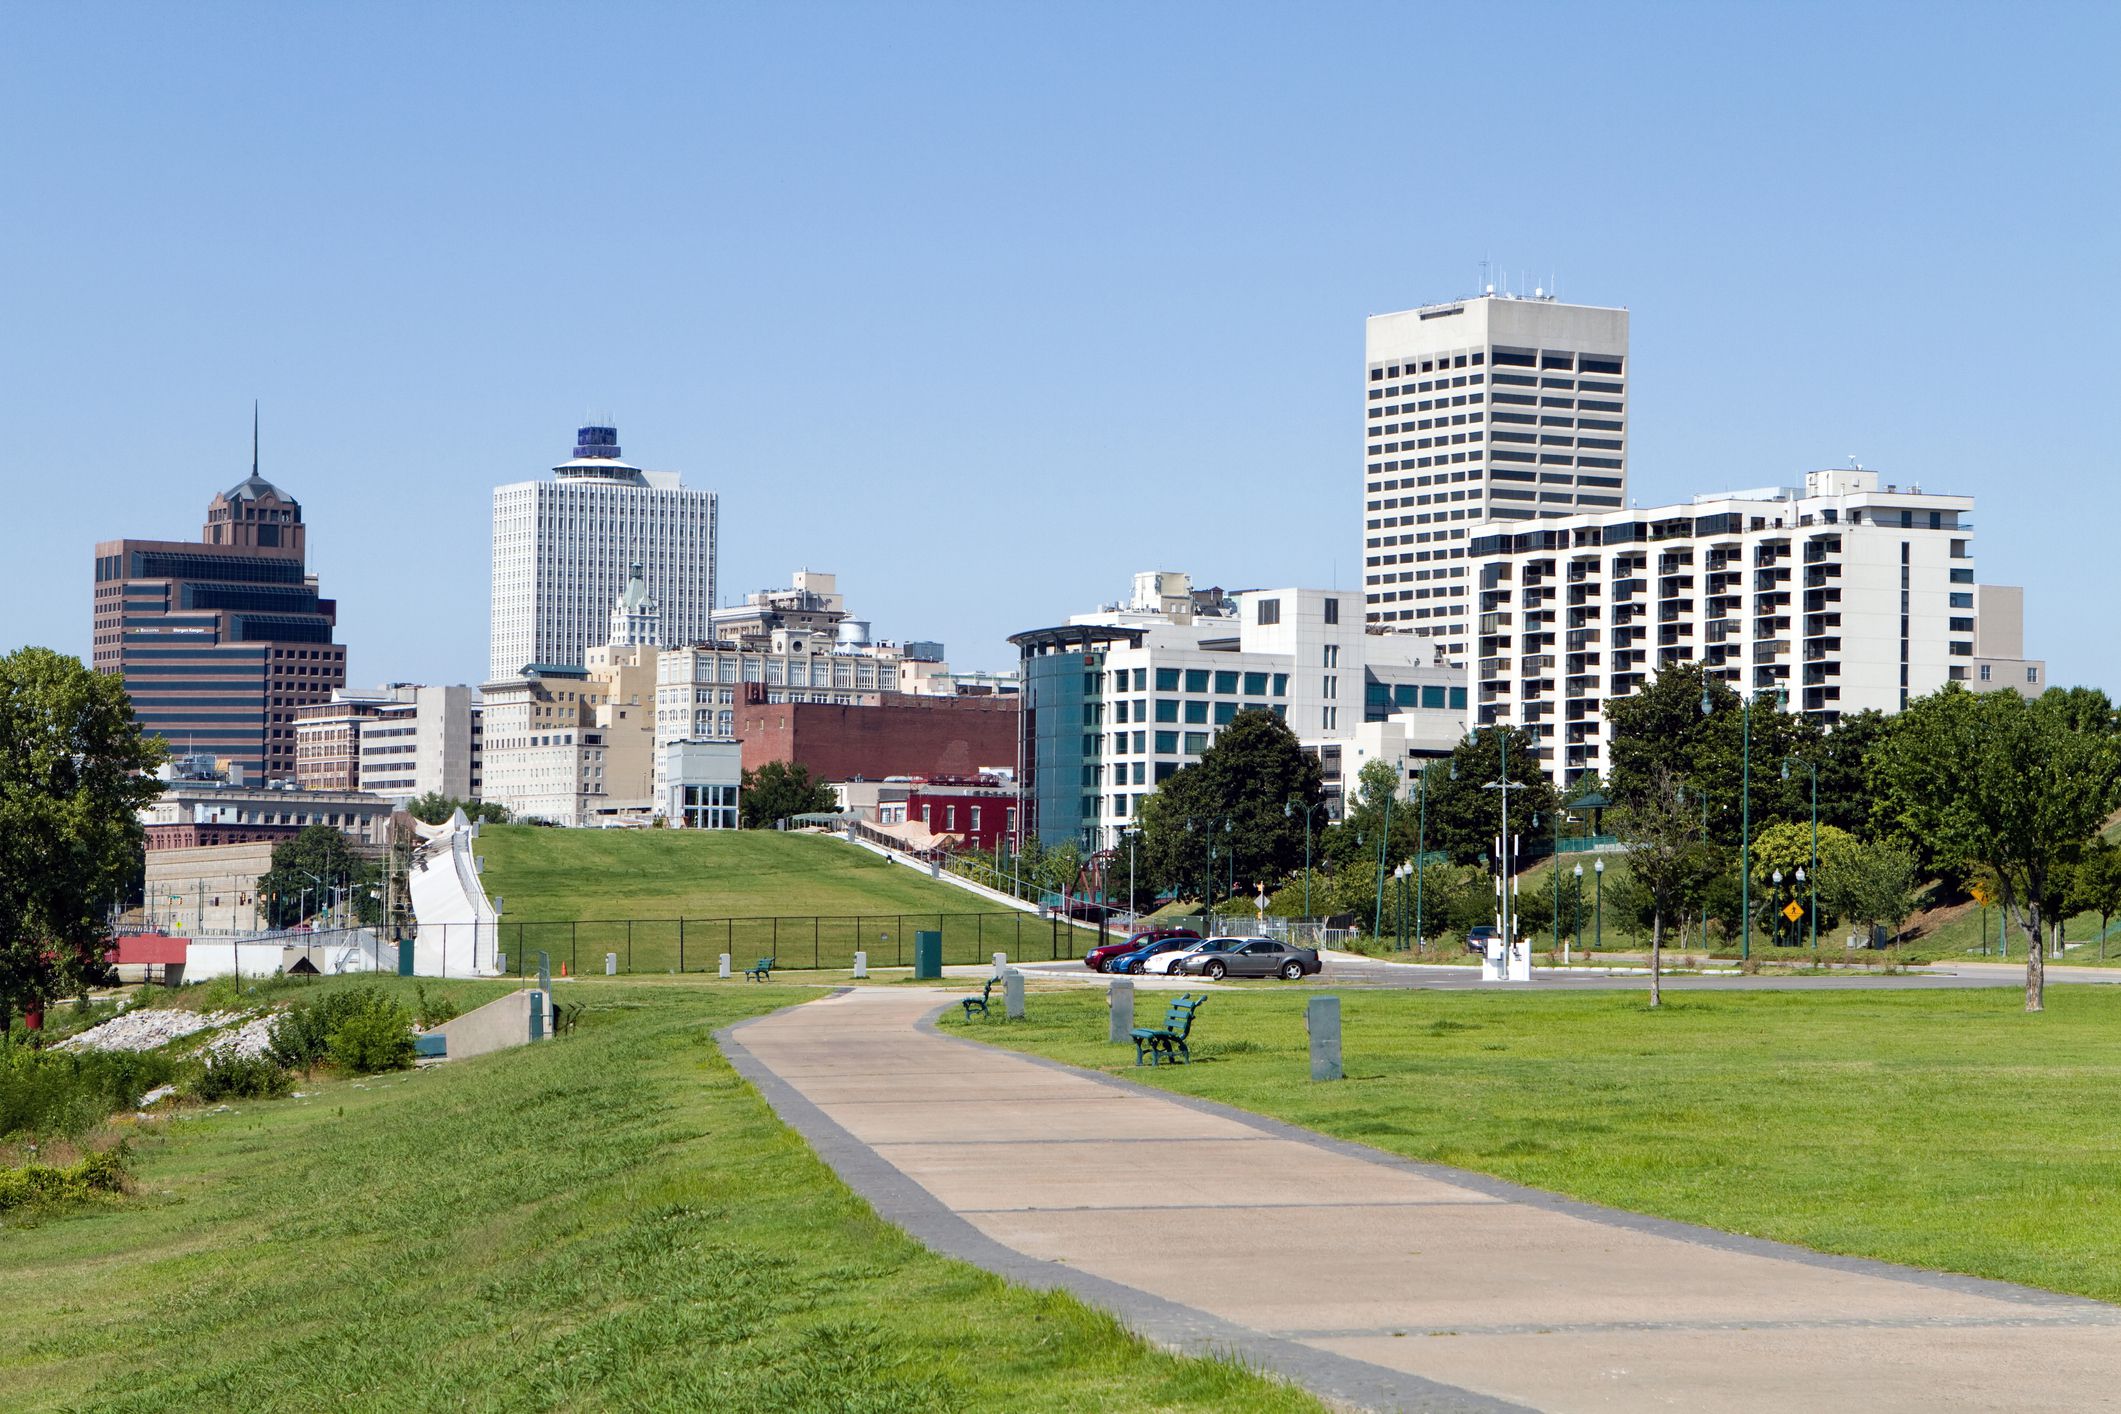
Number of parks: 194
City land devoted to parks and recreation: 5%
Percentage of residents living with a 10-minute walk: 46%
Unlike other low-ranked cities in the survey, Memphis’ communities of color and low-income residents enjoy the same amount of park space as their wealthier and white neighbors. This Mississippi River city ranks in the 64th percentile for rec centers and senior resources, but investment lags in other amenities such as basketball courts, playgrounds, and public restrooms in particular.
Related: How Long Can You Expect to Live in America’s Biggest Cities?
Where’s My City?
Methodology

According to the report’s authors, ParkScore ratings were calculated by assessing 14 data points across five categories. Factors include park size and percentage of city land; public and nongovernmental spending, as well as volunteer hours; amenities such as senior centers, playgrounds, pools, and restrooms; walkability and ease of pedestrian access; as well as neighborhood demographics such as race and income. Data was analyzed from more than 14,000 cities and towns across America.