Congestion on America’s roads continues to be a serious issue. In fact, Americans lost an average of 97 hours a year due to congestion in 2018. What’s more, the time lost in traffic costs the country about $87 billion annually, which breaks down to about $1,348 per driver, according to the Global Traffic Scorecard from INRIX. The scorecard provides a sweeping analysis of congestion and mobility trends in more than 200 cities across the globe. Here are the 30 most congested cities in the United States ranked in order from least to most congested. The ranking reflects not only time lost, but also the severity of congestion.
Related: 22 Cities Where You Can Live Without a Car
30. Sacramento, California
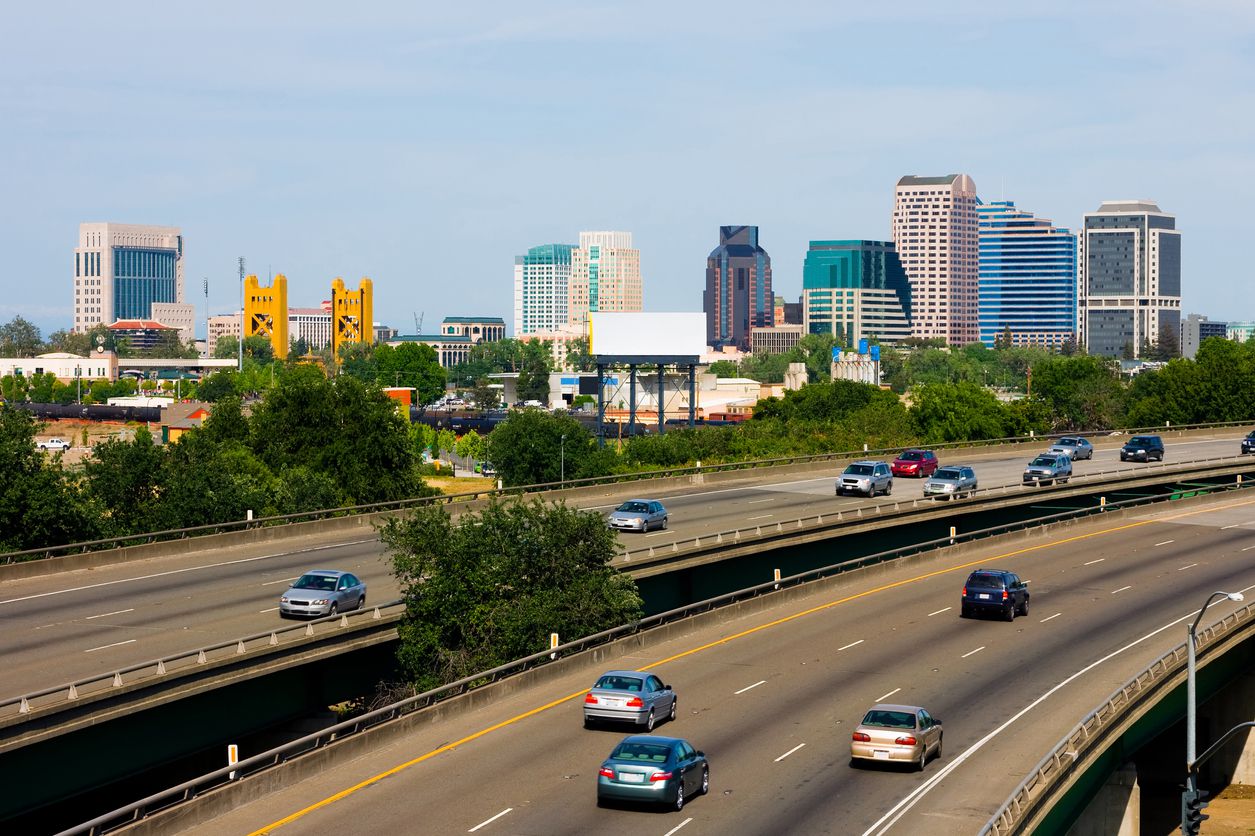
Hours lost in congestion: 69 Cost of congestion (per driver): $883 Congestion in Sacramento increased 3% between 2017 and 2018. INRIX transportation analyst Trevor Reed says congestion will continue to have serious consequences for national and local economies, businesses, and citizens for years to come. “If we’re to avoid traffic congestion becoming a further drain on our economy, we must invest in intelligent transportation systems to tackle our mobility challenges,” Reed said.
29. Buffalo, New York
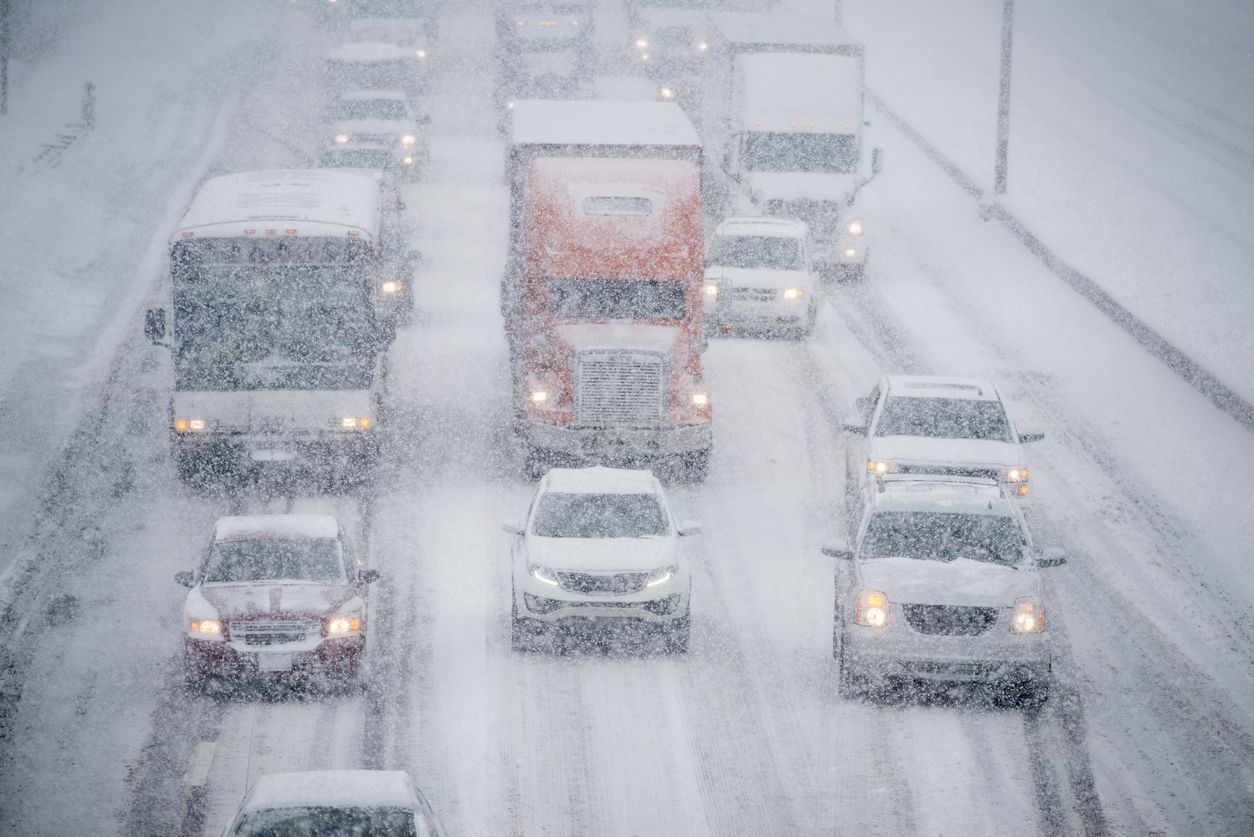
Hours lost in congestion: 72 Cost of congestion (per driver): $1,009 It’s not enough that Buffalo is one of the coldest and snowiest places in the country. The city also has congestion challenges. Between 2017 and 2018, congestion increased 5%.
28. Lexington, Kentucky
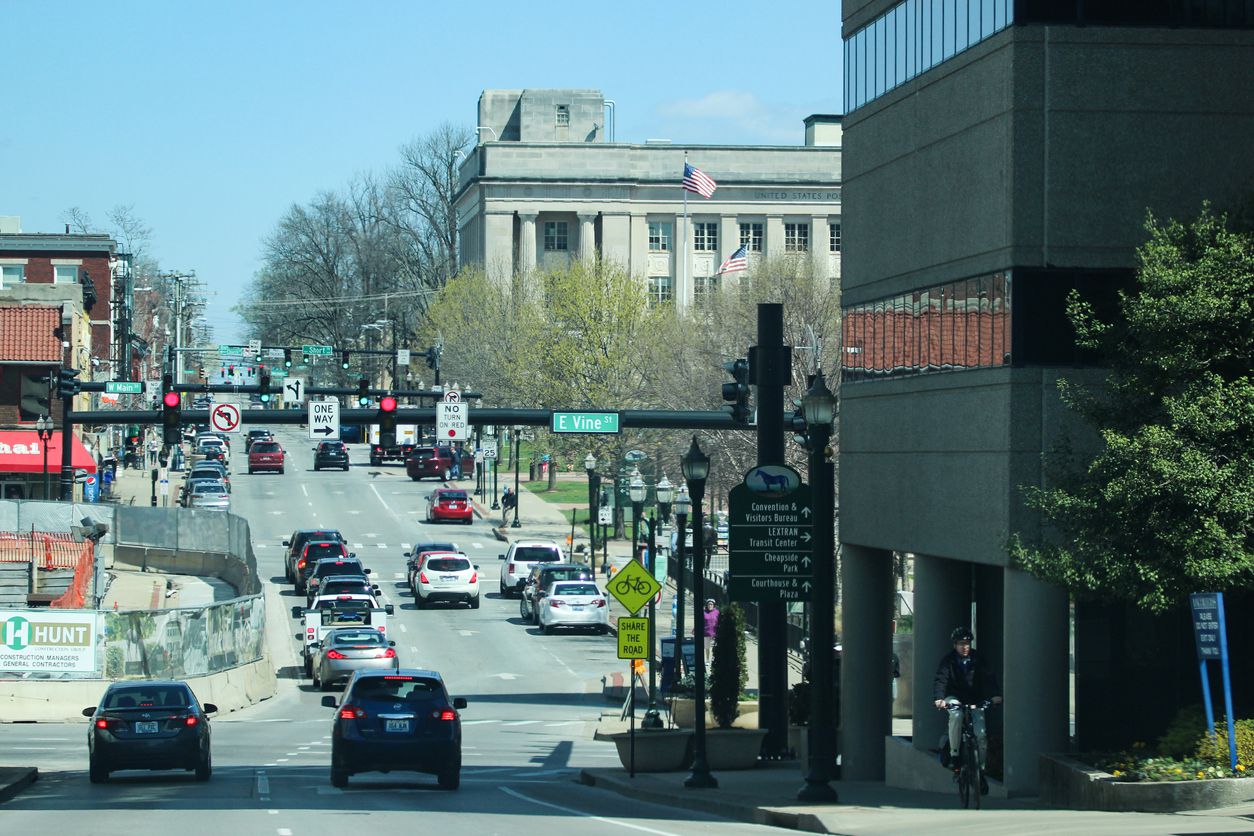
Hours lost in congestion: 79 Cost of congestion (per driver): $1,108 In Lexington, there seems to be some improvement in the congestion situation, with a 7% decrease between 2017 and 2018.
27. Detroit
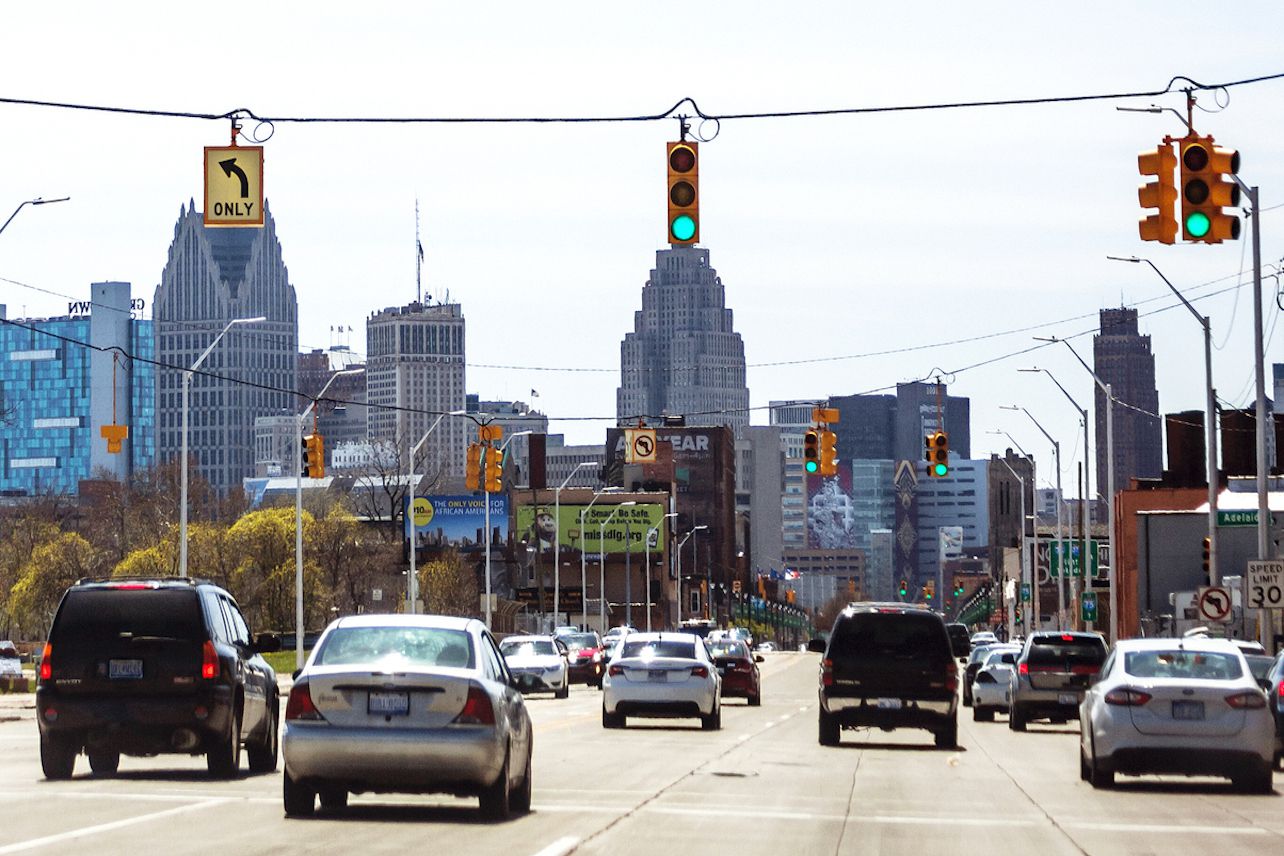
Hours lost in congestion: 66 Cost of congestion (per driver): $926 Detroit is among the U.S. cities where congestion is worsening, with a 5% increase since 2017.
26. New Orleans
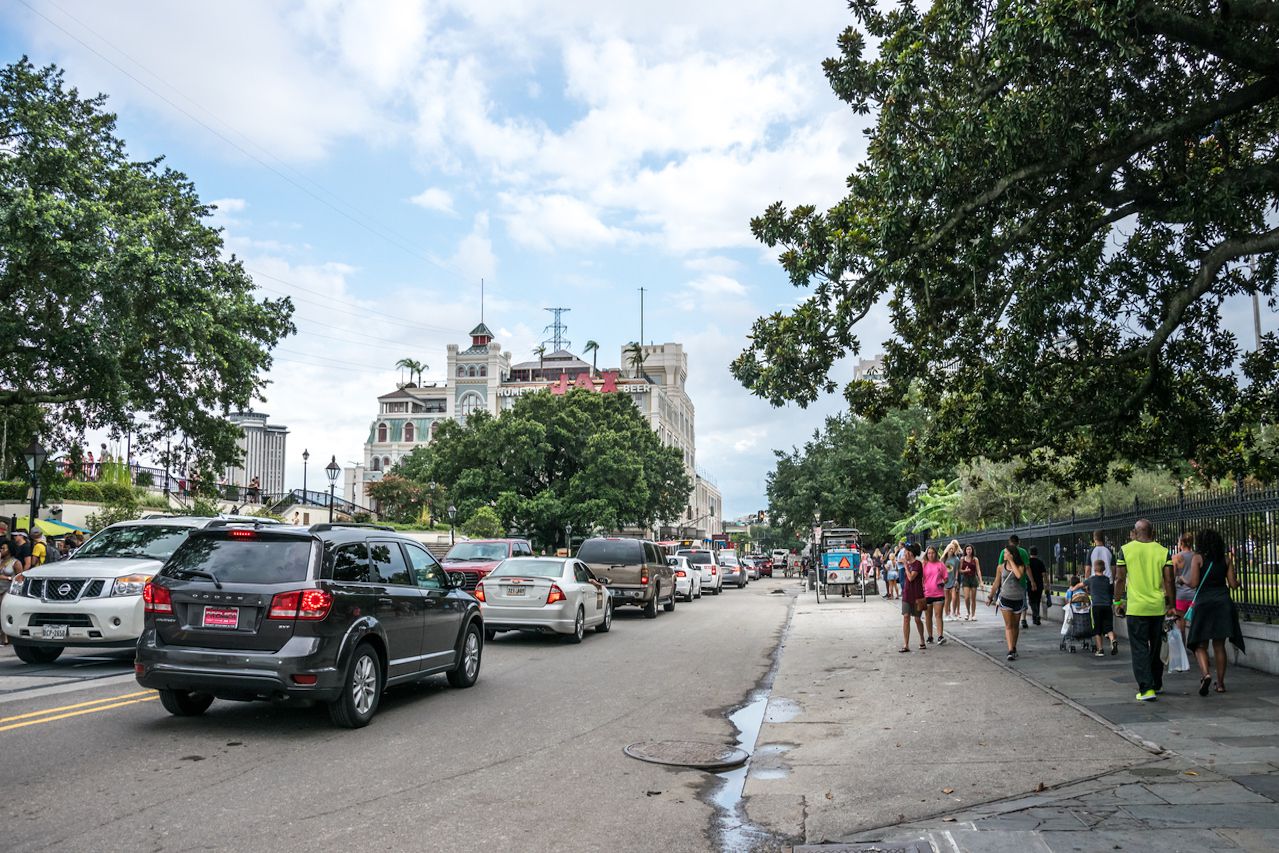
Hours lost in congestion: 73 Cost of congestion (per driver): $1,023 Congestion in the Big Easy is getting worse with each passing year as well, increasing 7% between 2017 and 2018. The inner-city last-mile speed in the city is 12 mph. The inner-city last-mile speed is the speed at which a driver can expect to travel the final mile of their trip within a city’s central business district during peak hours.
Trending on Cheapism

25. Columbus, Ohio
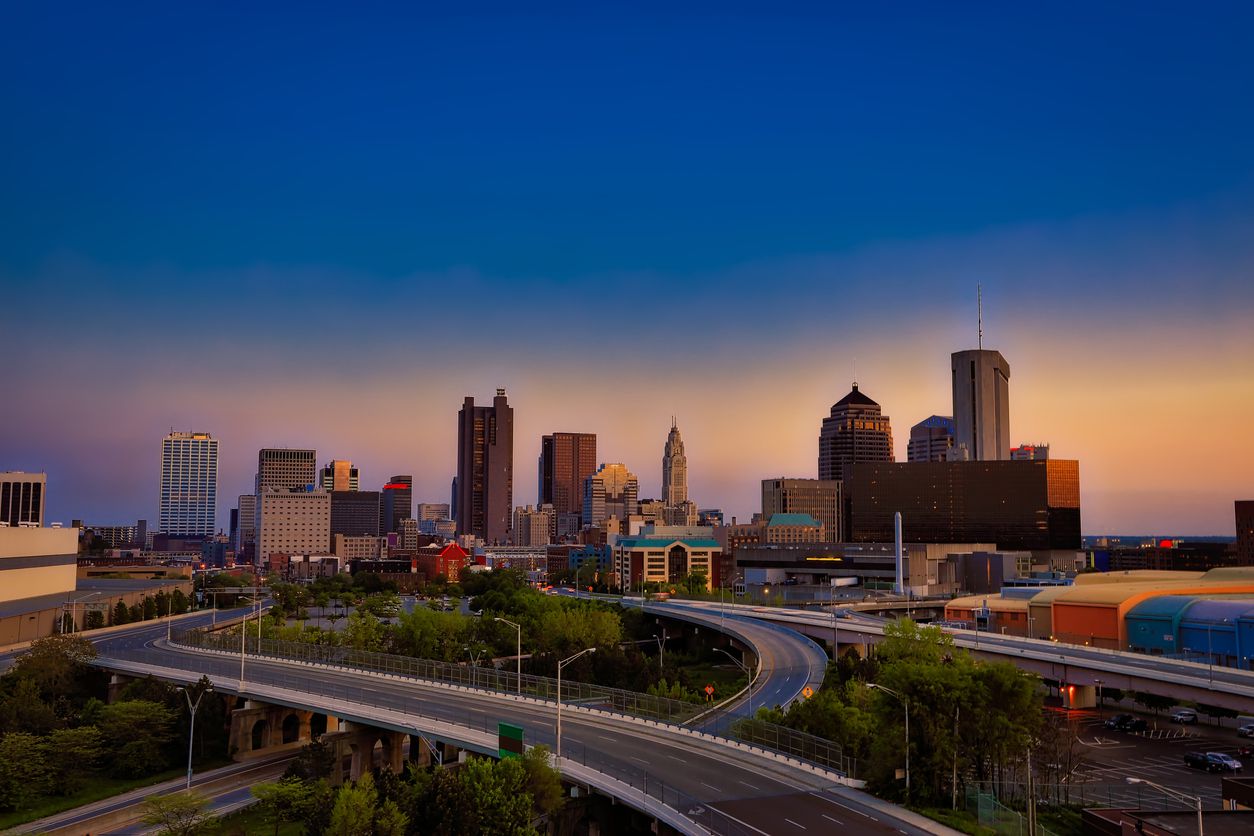
Hours lost in congestion: 71 Cost of congestion (per driver): $990 Traffic congestion has increased 6% from 2017 to 2018 in Columbus, where the inner-city last-mile speed is about 14 mph.
24. Minneapolis
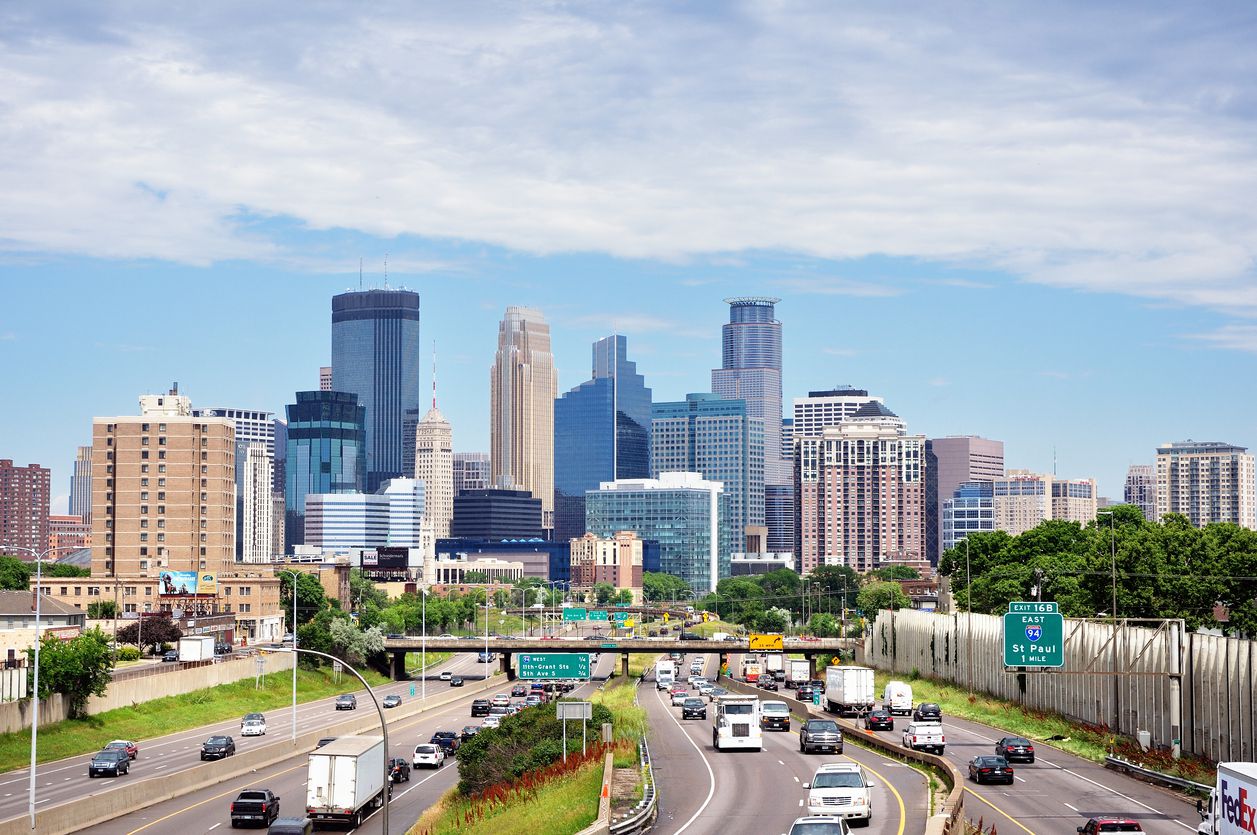
Hours lost in congestion: 70 Cost of congestion (per driver): $971 Minneapolis is also facing a worsening traffic situation with a 4% increase in congestion between 2017 and 2018. Like Columbus, the inner-city last-mile speed here is 14 mph.
23. Orlando, Florida
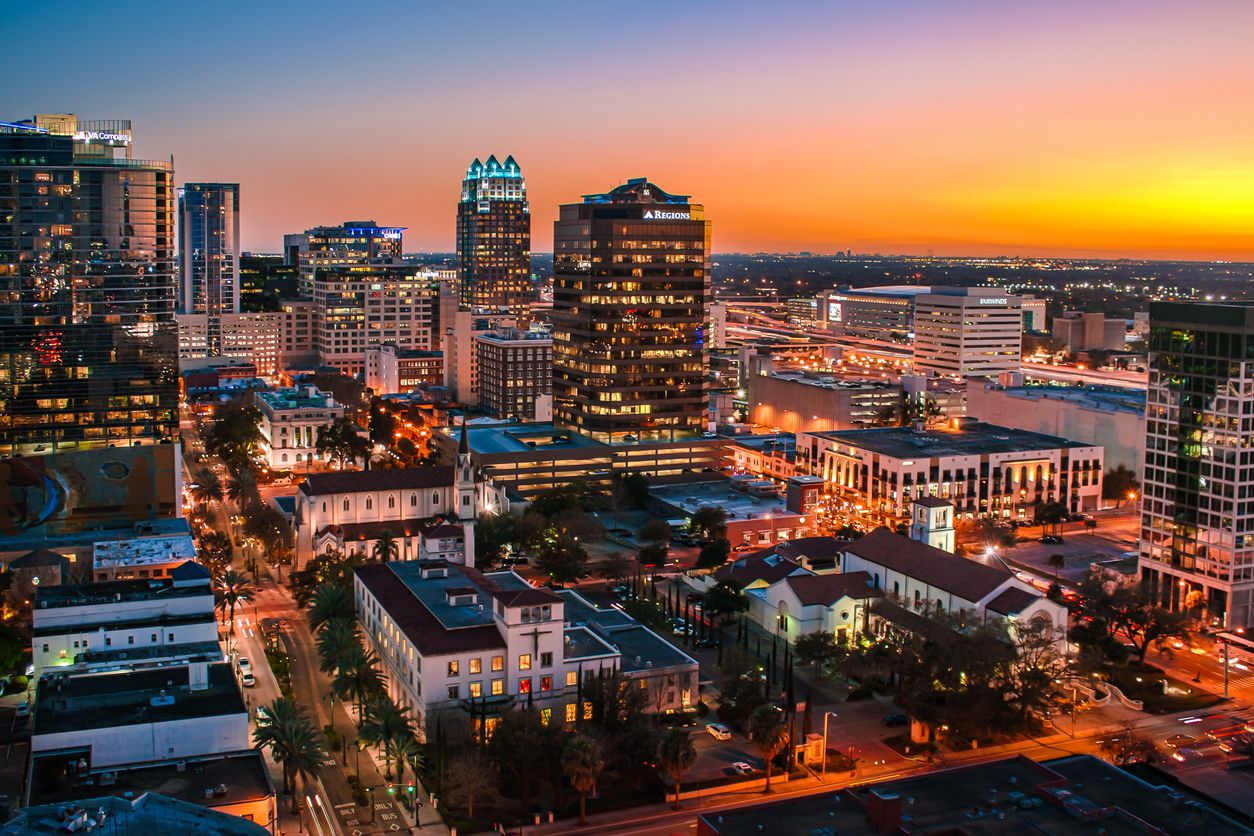
Hours lost in congestion: 74 Cost of congestion (per driver): $1,037 Orlando has experienced a steep 16% increase in traffic congestion year over year. The inner-city last-mile speed is 15 mph.
Sign up for our newsletter
22. Phoenix
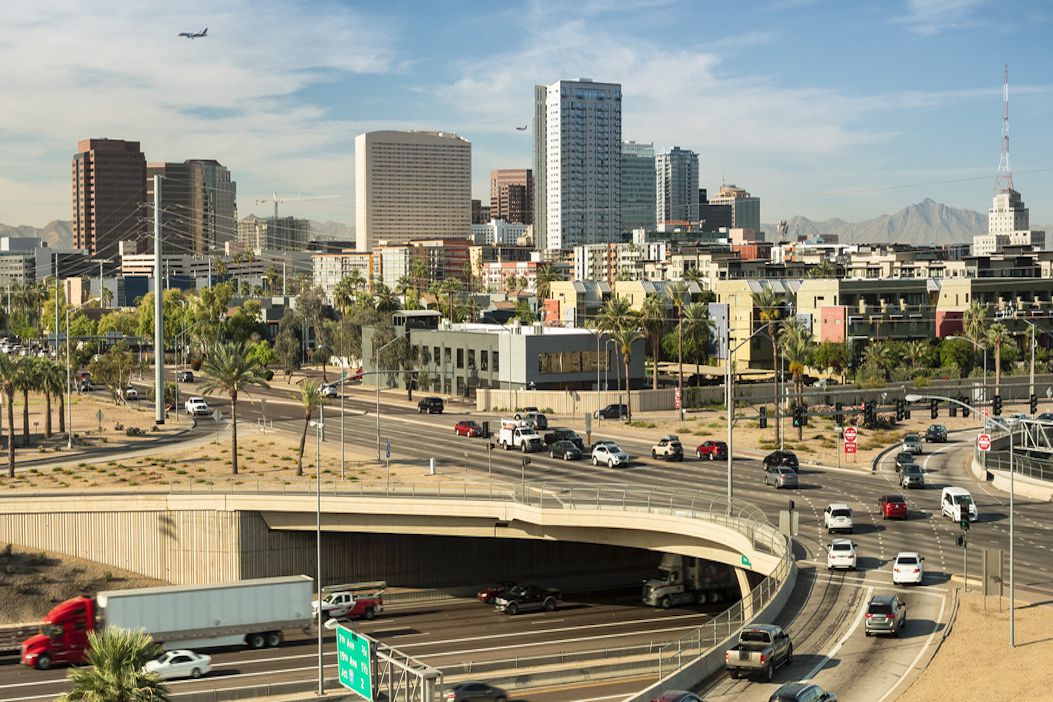
Hours lost in congestion: 73 Cost of congestion (per driver): $1,013 In Phoenix, congestion has ticked up about 3% year over year between 2017 and 2018. The inner-city last-mile speed is 17 mph.
21. Dallas
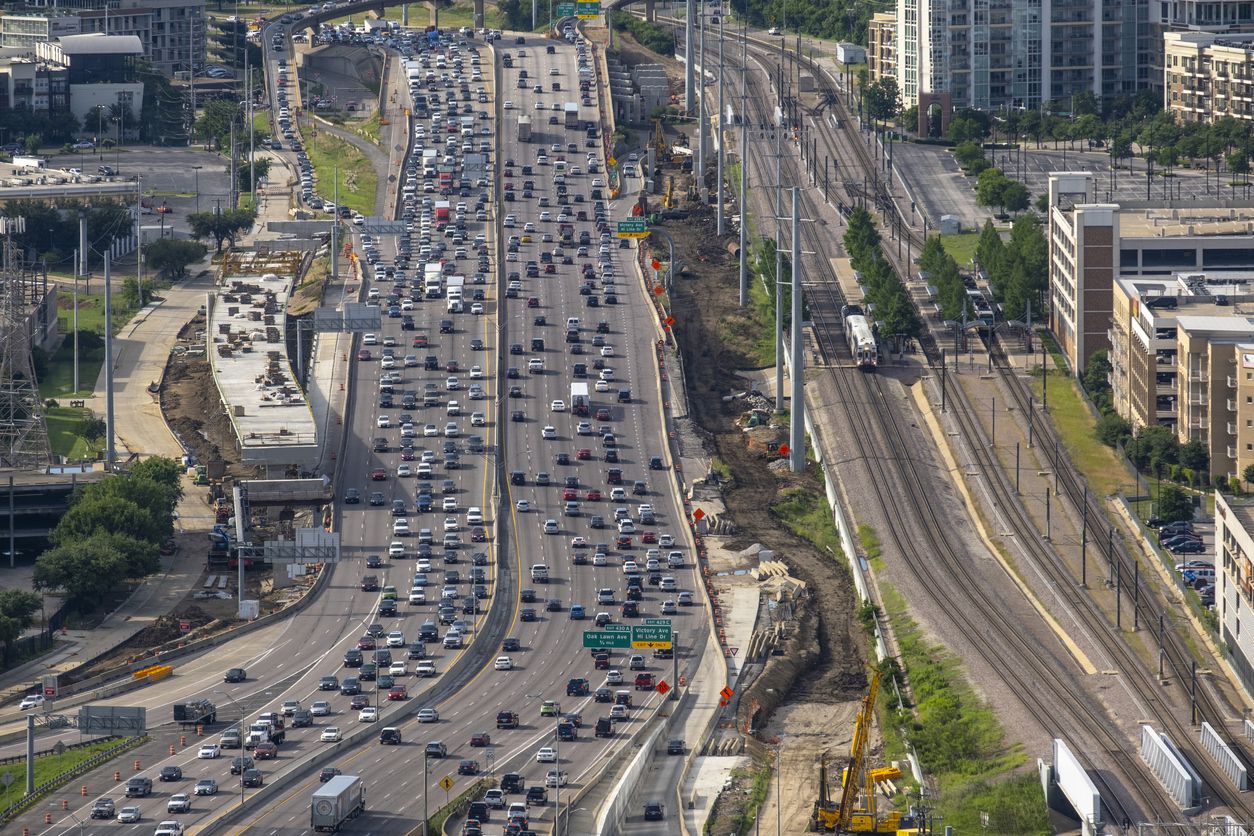
Hours lost in congestion: 76 Cost of congestion (per driver): $1,065 Congestion in Dallas has seen a 6% rise between 2017 and 2018, while the inner-city last-mile speed here is 17 mph.
20. Nashville, Tennessee
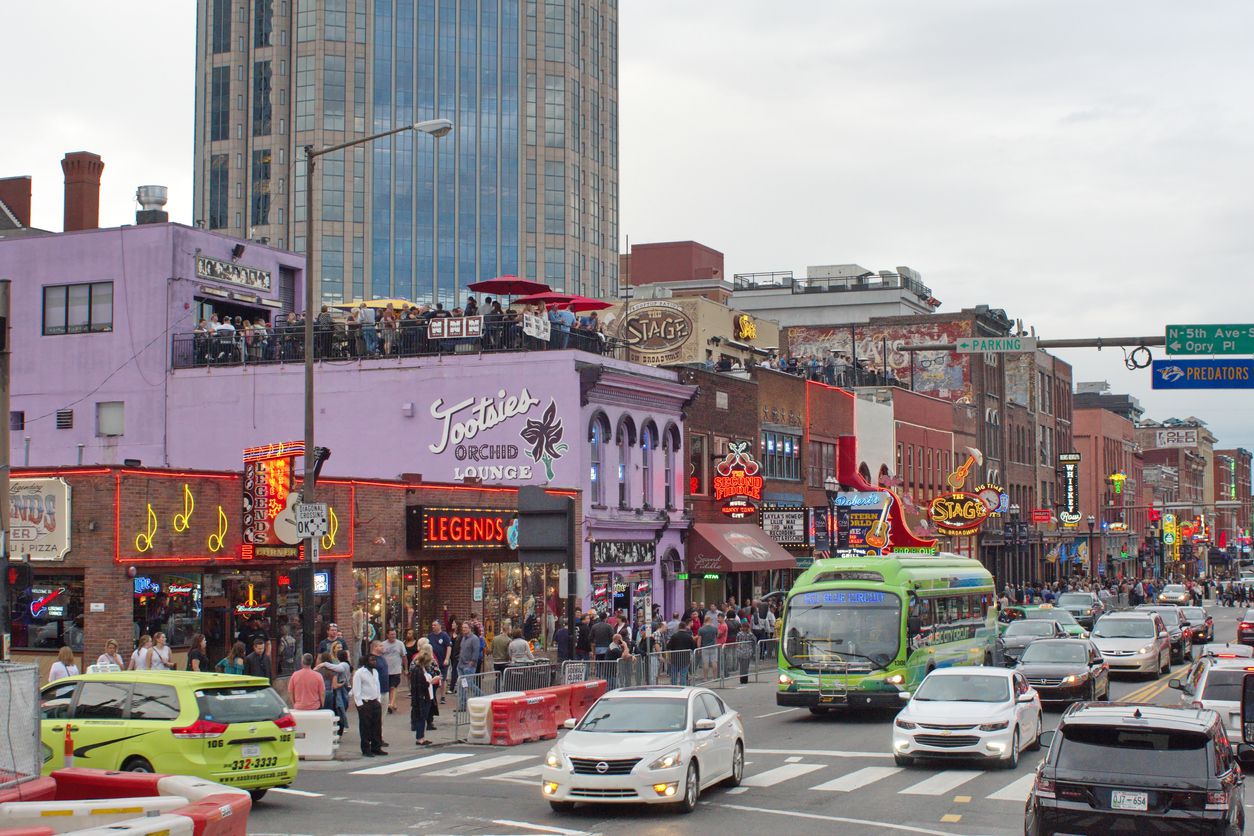
Hours lost in congestion: 87 Cost of congestion (per driver): $1,221 Nashville is clearly experiencing some serious traffic challenges. Between 2017 and 2018 congestion worsened a whopping 20%. The inner-city last-mile speed in the country music capital is 16 mph.
19. Denver
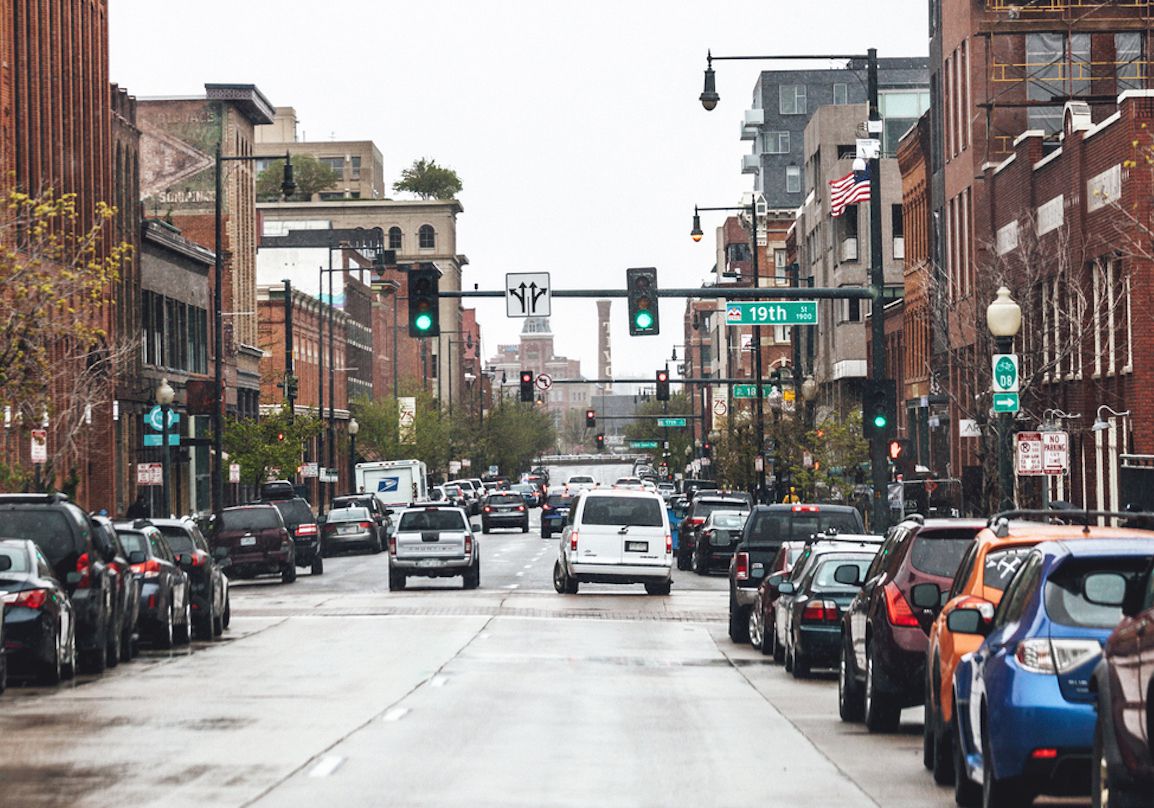
Hours lost in congestion: 83 Cost of congestion (per driver): $1,152 Denver is clearly doing something right. Traffic congestion in the city decreased about 3% year over year between 2017 and 2018. The inner-city last-mile speed is 13 mph.
18. Honolulu
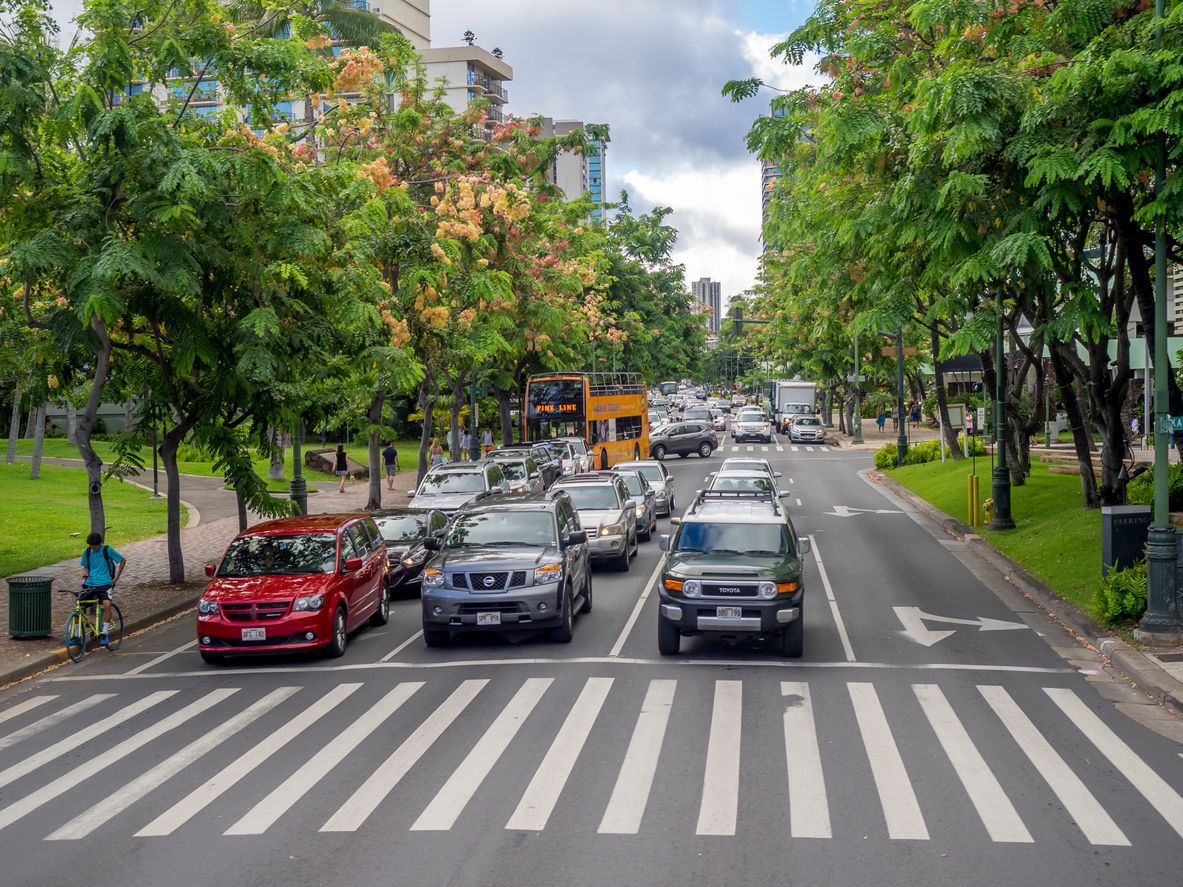
Hours lost in congestion: 92 Cost of congestion (per driver): $1,282 Like Denver, the city of Honolulu appears to be on the right track as well. Congestion here dropped 4% year over year.
17. Tampa, Florida
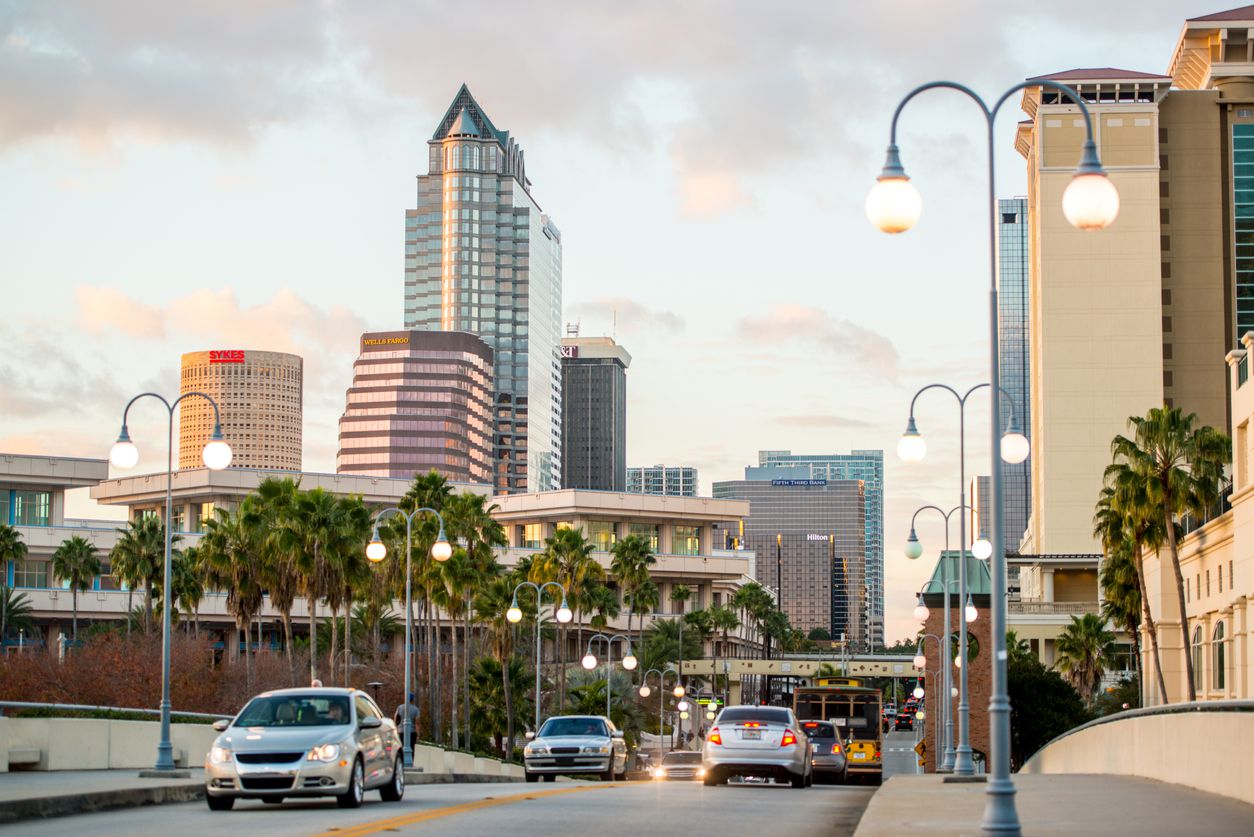
Hours lost in congestion: 87 Cost of congestion (per driver): $1,216 Tampa is another city that’s experiencing a significant worsening of congestion. There was an 11% increase between 2017 and 2018. The inner-city last-mile speed in Tampa is 13 mph.
16. Charlotte, North Carolina
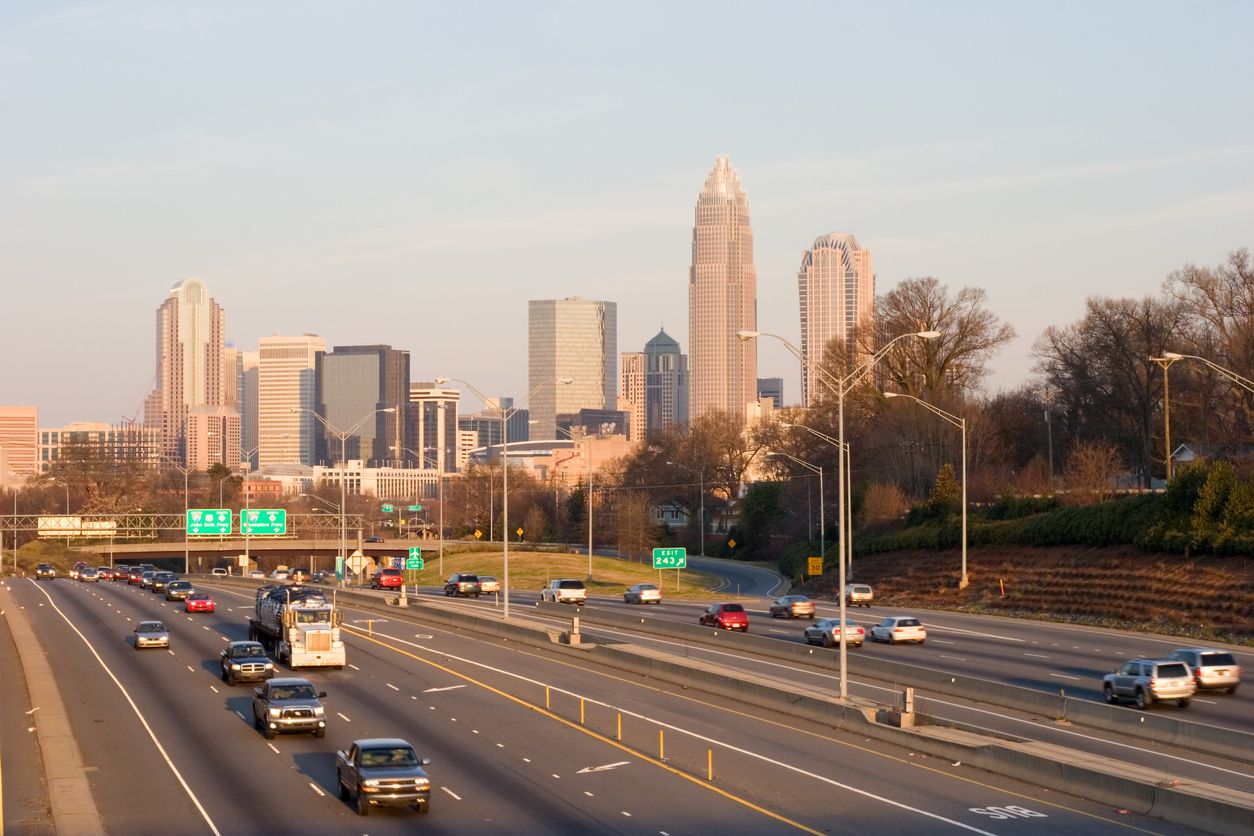
Hours lost in congestion: 95 Cost of congestion (per driver): $1,332 In Charlotte, there was no change in the traffic congestion levels between 2017 and 2018. The inner-city last-mile speed in the city is 12 mph.
15. Baltimore
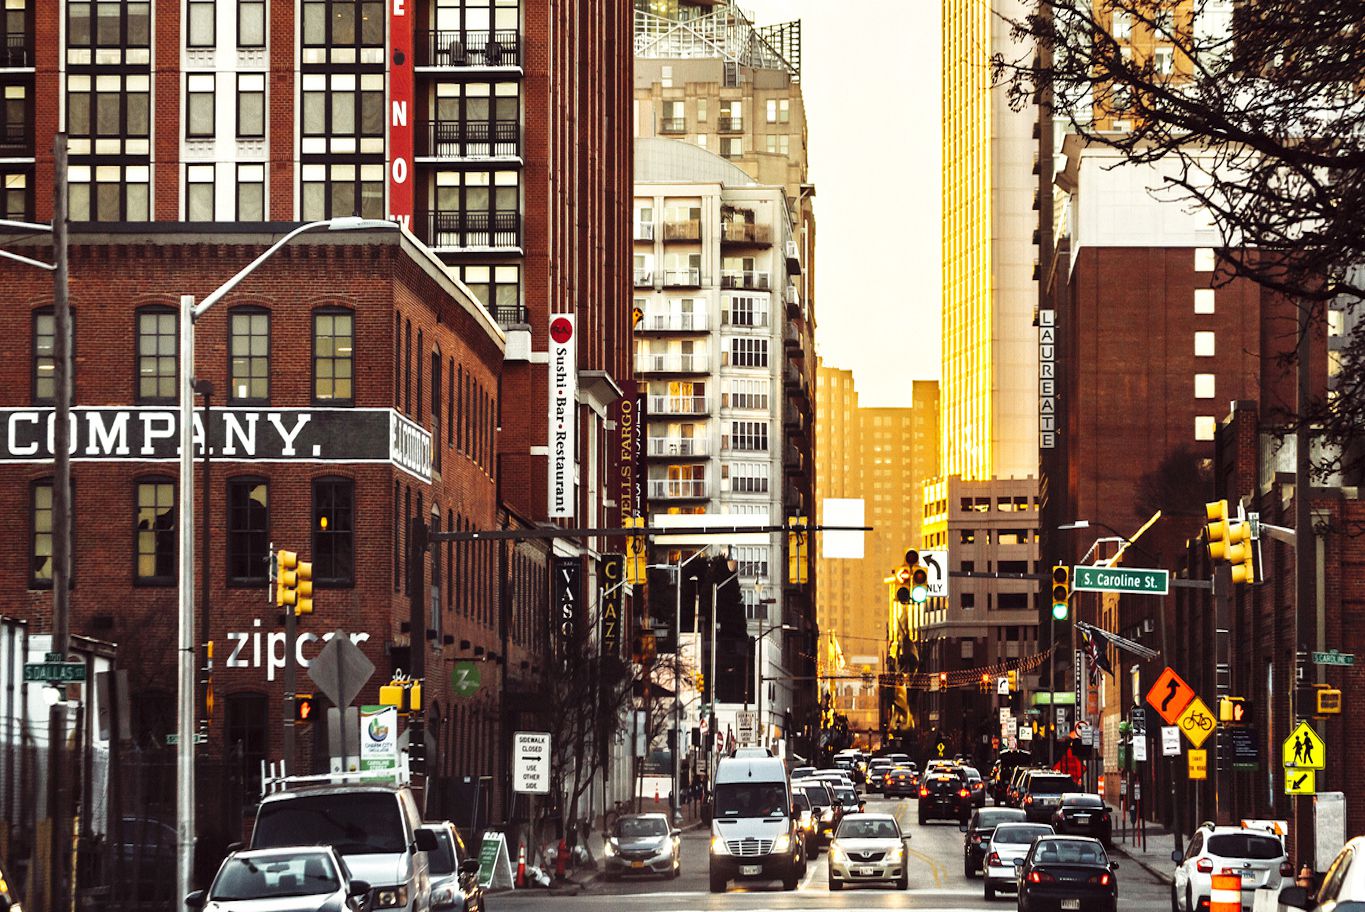
Hours lost in congestion: 94 Cost of congestion (per driver): $1,315 Baltimore has seen a slight worsening of congestion from 2017 to 2018. The city has witnessed a 3% increase. The inner-city last-mile speed is 10 mph.
14. Austin, Texas
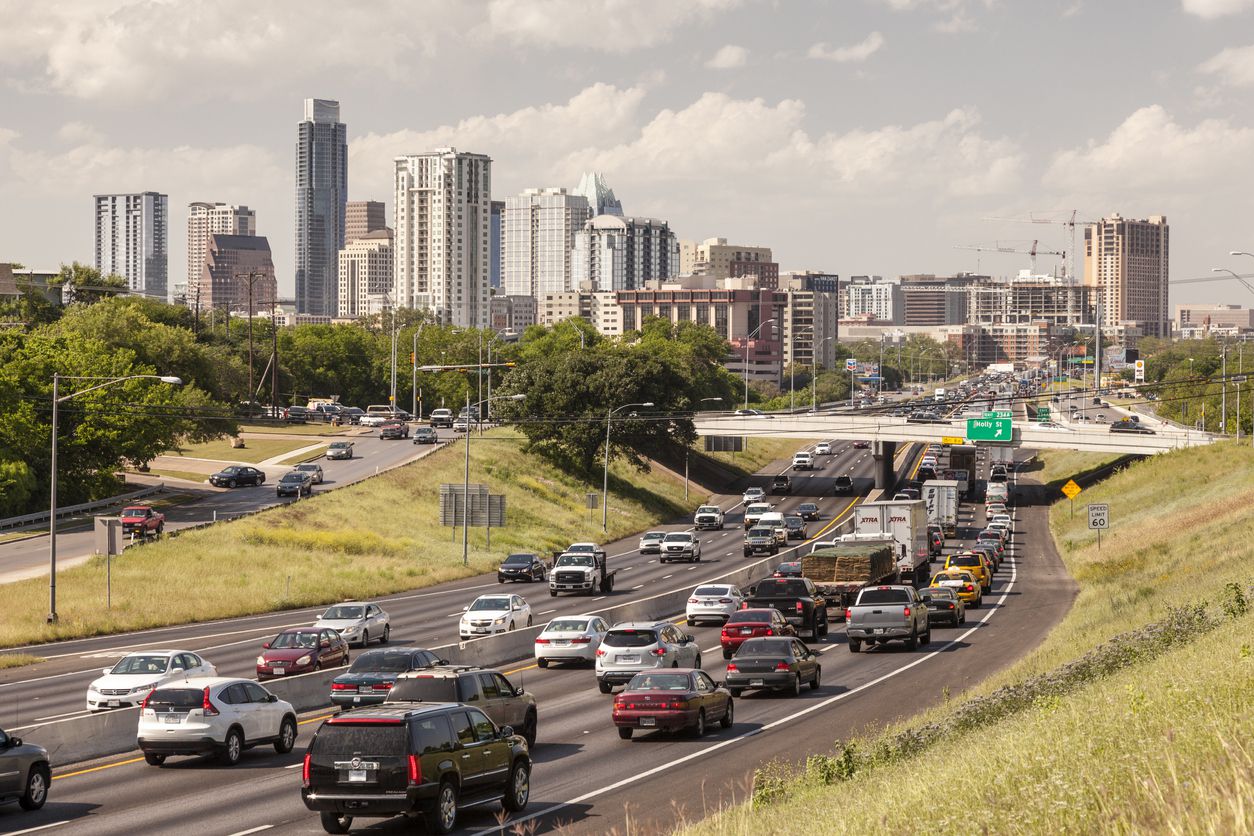
Hours lost in congestion: 104 Cost of congestion (per driver): $1,452 Traffic congestion in Austin has declined 2% year over year. The inner-city last-mile speed here is 13 mph.
13. Houston
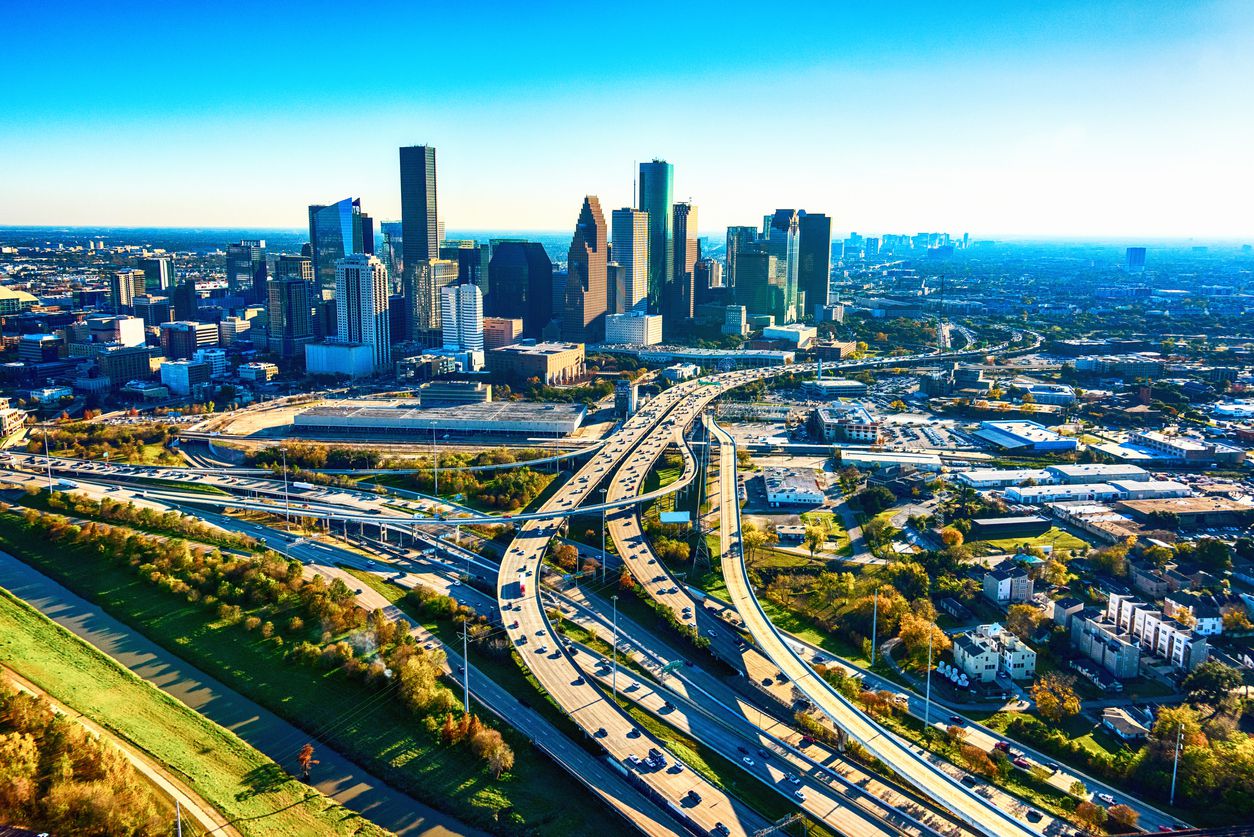
Hours lost in congestion: 98 Cost of congestion (per driver): $1,365 Houston’s congestion increased 6% between 2017 and 2018. The inner-city last-mile speed for the South Texas city is 15 mph.
12. Miami
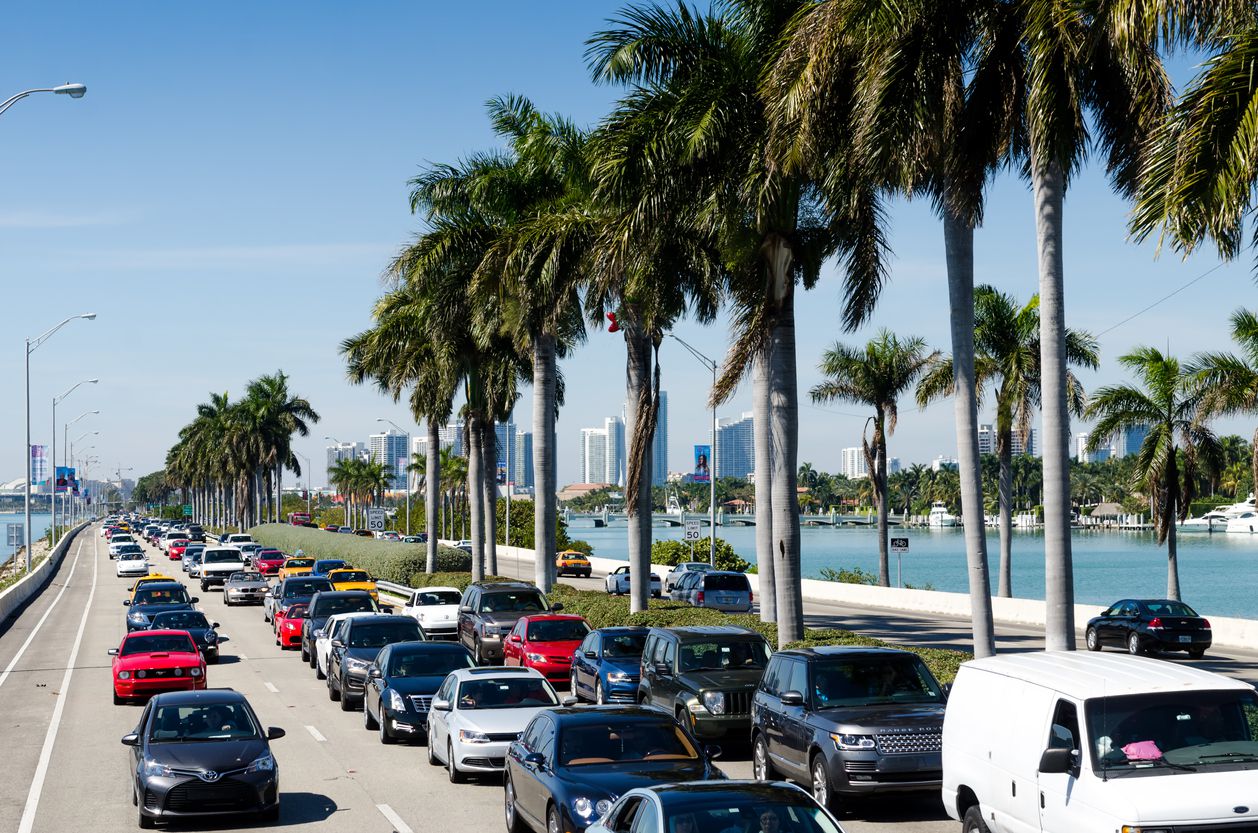
Hours lost in congestion: 105 Cost of congestion (per driver): $1,470 Congestion levels in Miami are headed in the right direction. The city recorded a 5% decrease year over year. The inner-city last-mile speed is 12 mph.
11. Atlanta
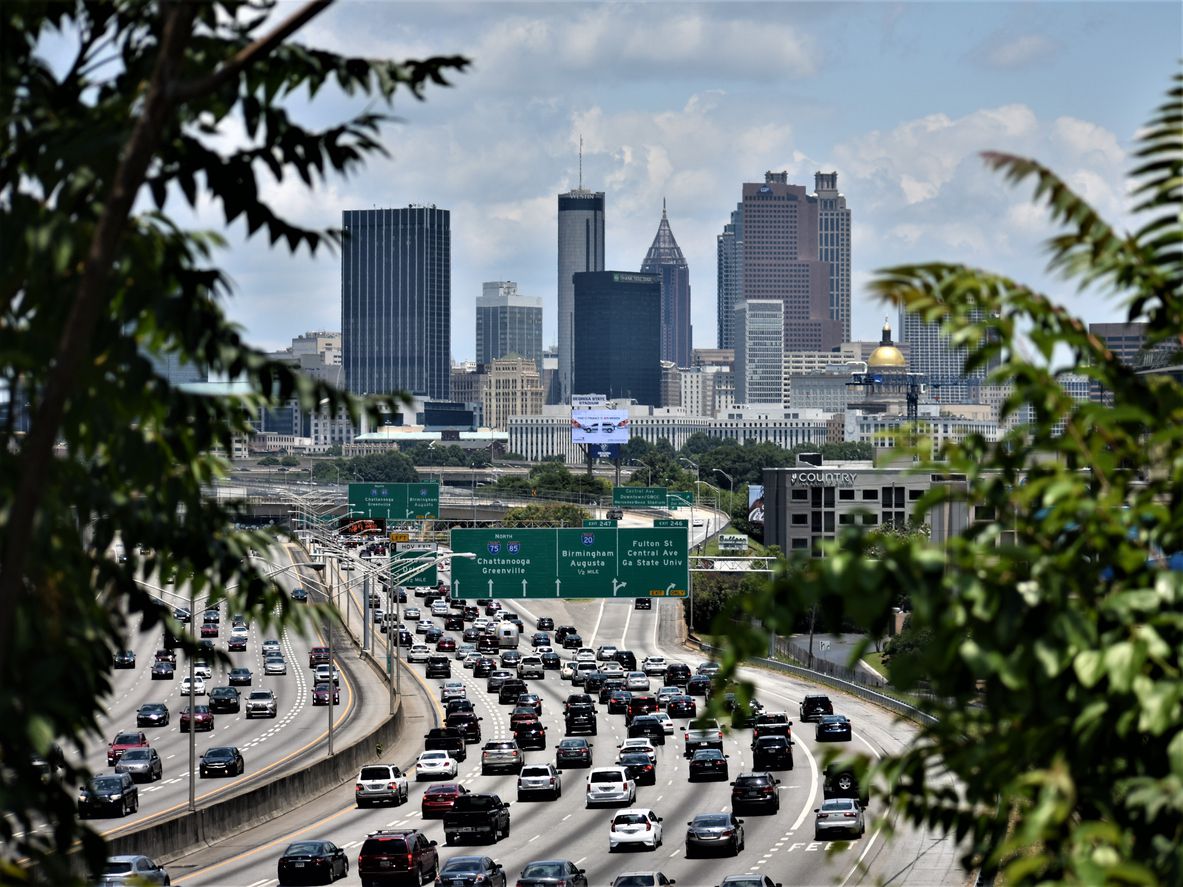
Hours lost in congestion: 108 Cost of congestion (per driver): $1,505 Atlanta’s traffic snarls are the stuff of legend. So, it’s not entirely surprising this city has seen a substantial 10% increase in congestion year over year. The inner-city last-mile speed is 14 mph.
10. Portland, Oregon
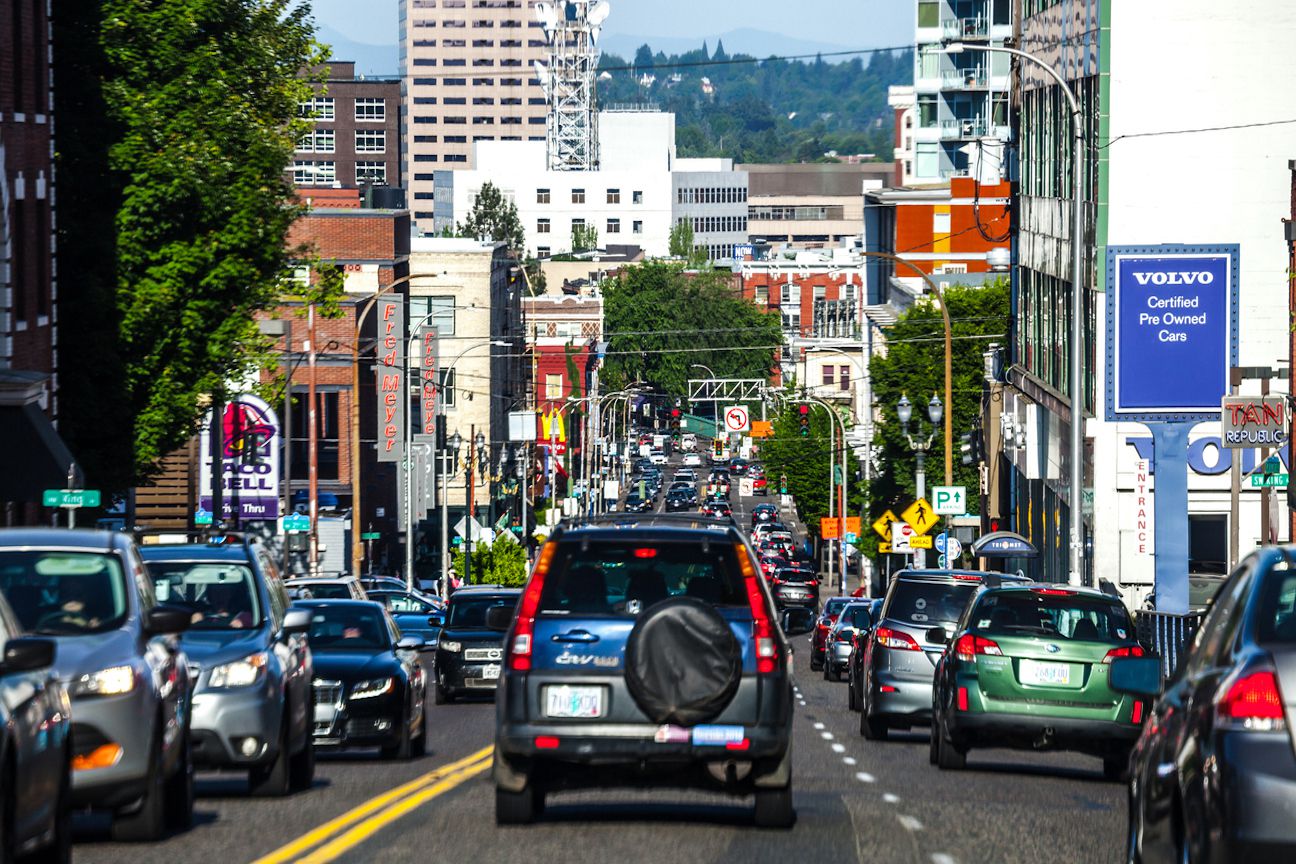
Hours lost in congestion: 116 Cost of congestion (per driver): $1,625 Making it into the top 10 most congested cities in the country, Portland has experienced a 9% decrease in traffic congestion between 2017 and 2018. It’s inner city last-mile speed is 13 mph.
9. Philadelphia
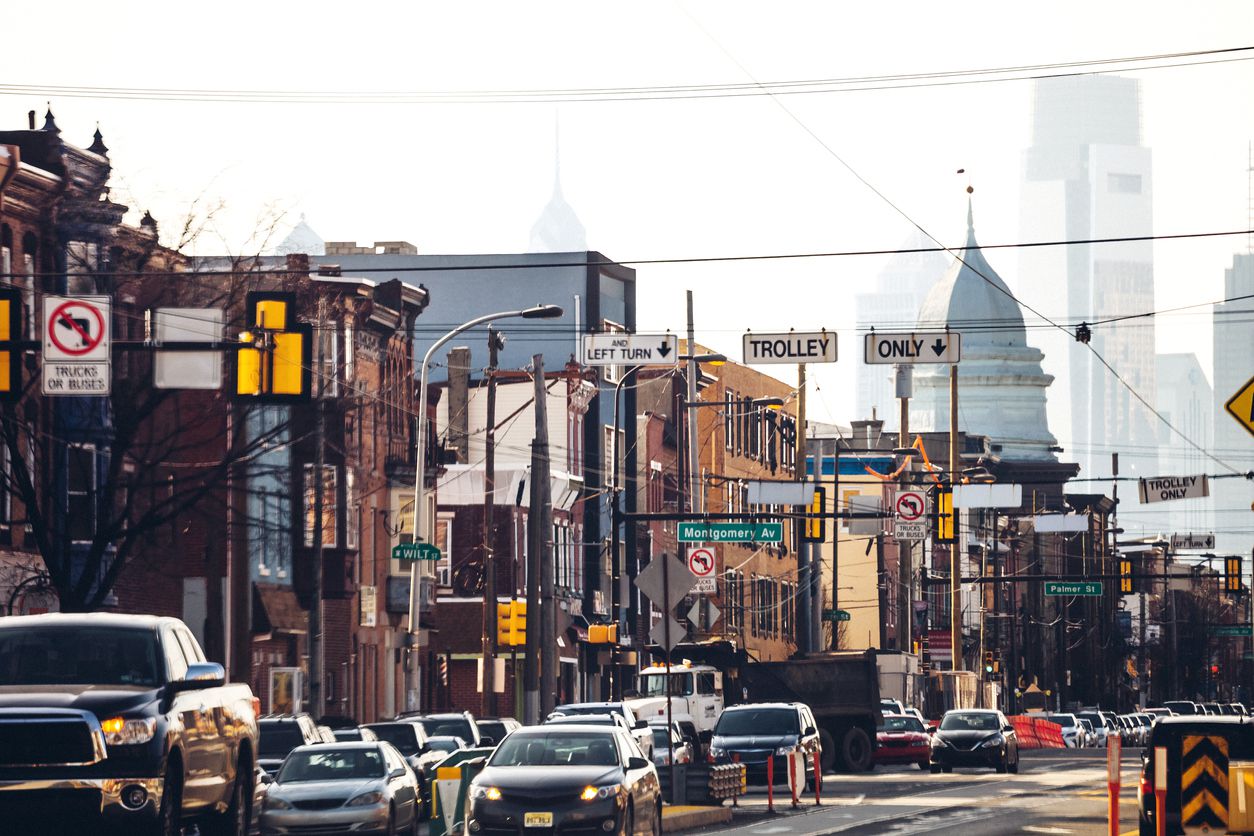
Hours lost in congestion: 112 Cost of congestion (per driver): $1,568 Philadelphia has experienced no change in congestion levels between 2017 and 2018. Though its inner-city last-mile speed is just 10 mph.
8. San Francisco
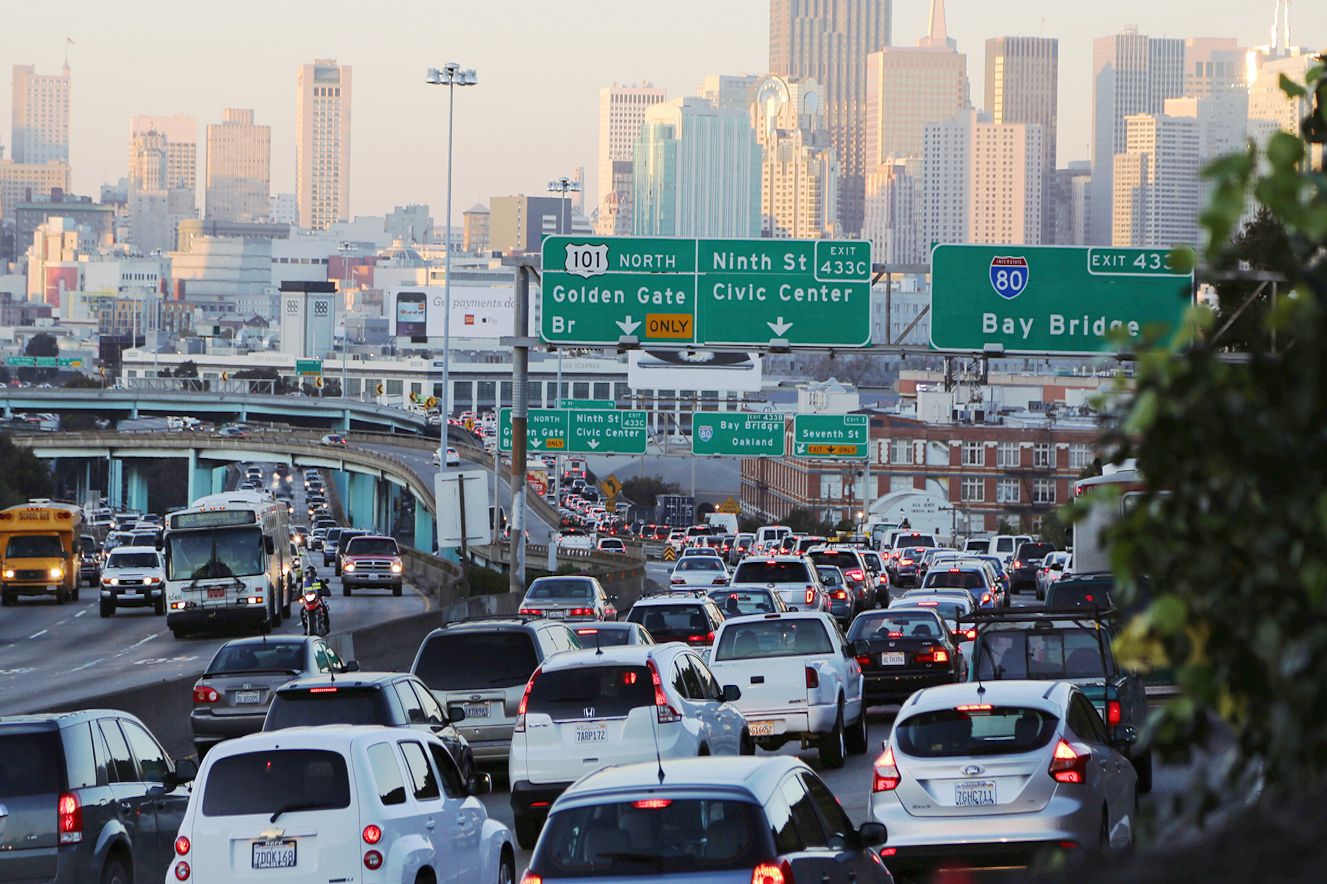
Hours lost in congestion: 116 Cost of congestion (per driver): $1,624 San Francisco’s congestion levels have decreased 5% year over year. Still, the decrease wasn’t enough to keep this city from making it into the top 10 most congested cities in the country.
7. Pittsburgh
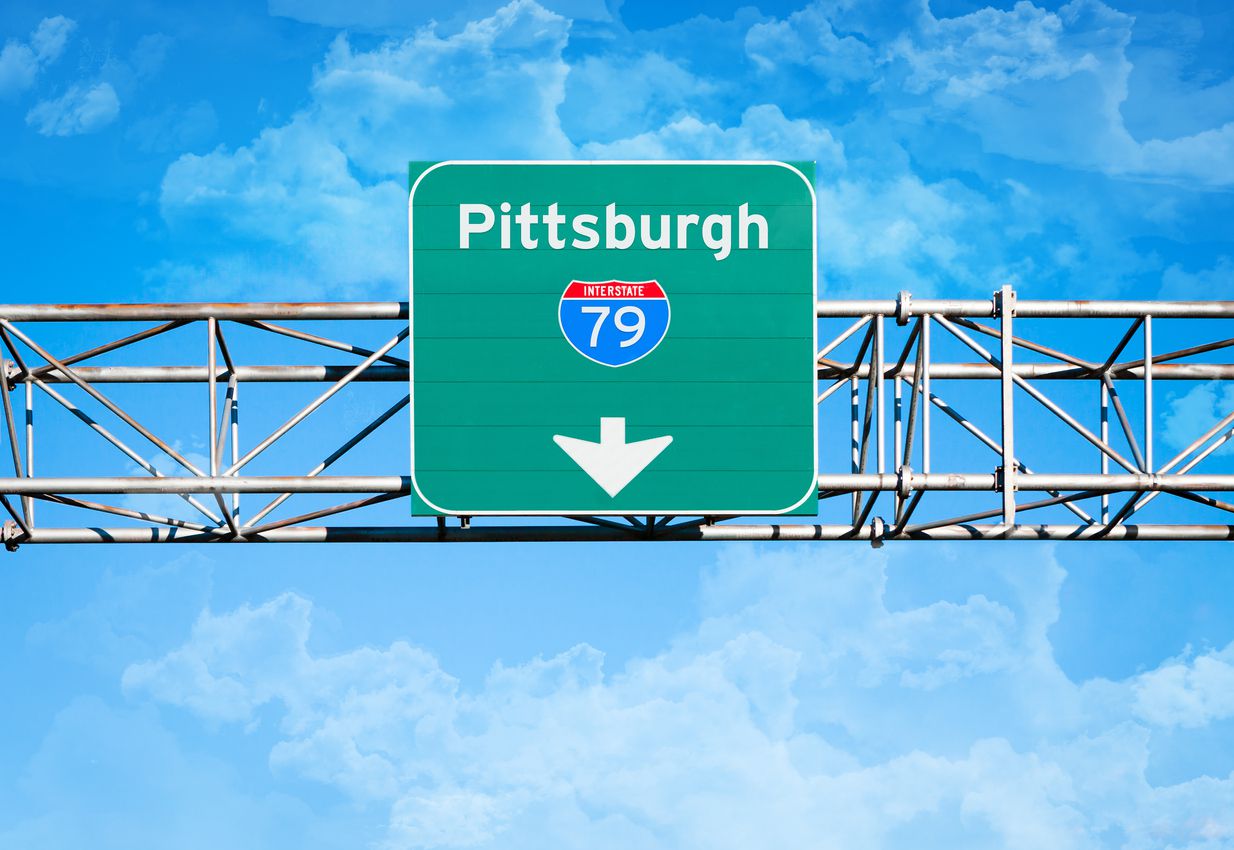
Hours lost in congestion: 127 Cost of congestion (per driver): $1,776 Pittsburgh is the location of the nation’s fifth most congested roadway. The I-376 is the road to avoid in the city, particularly between I-79 and the Pennsylvania Turnpike, where the average daily delay is 18 minutes.
6. Seattle
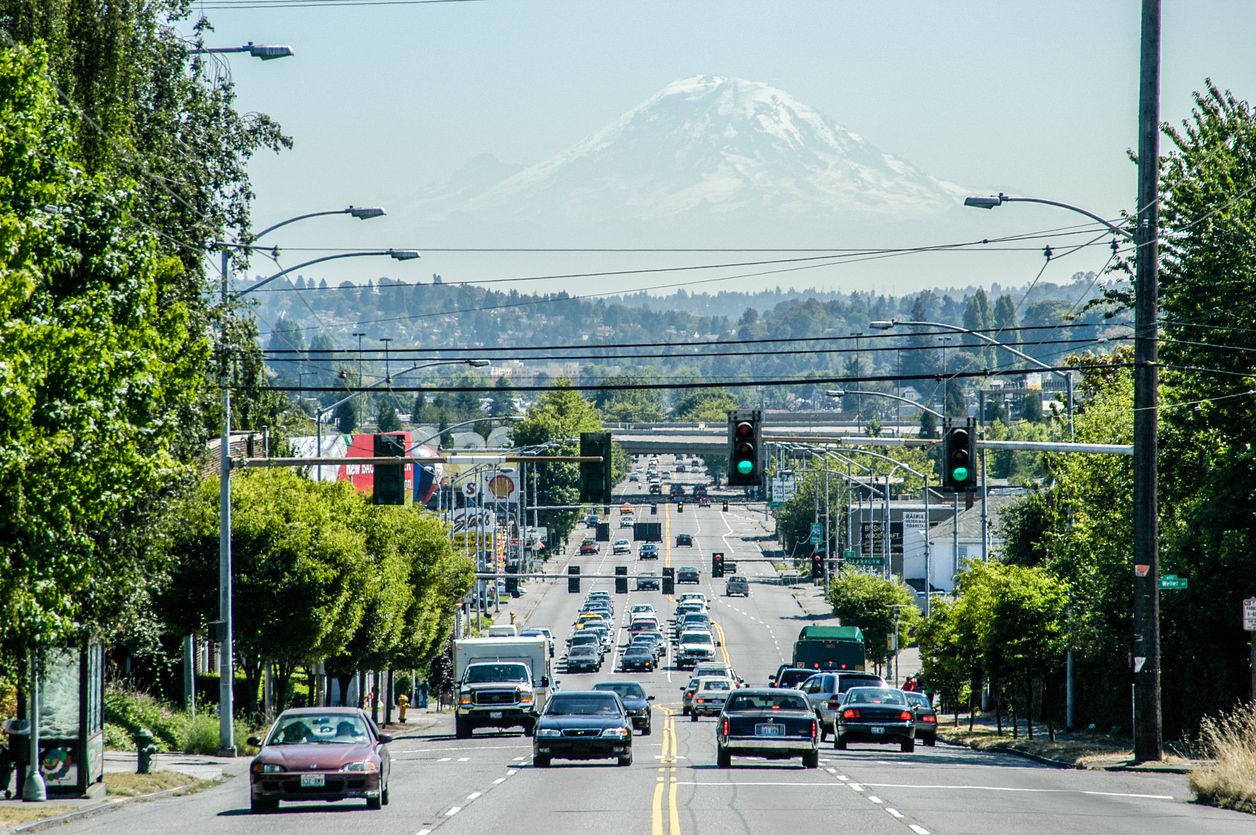
Hours lost in congestion: 138 Cost of congestion (per driver): $1,932 A city legendary for its substantial annual rainfall and being the location of such companies as Amazon and Microsoft, Seattle also has its share of congestion challenges. In the sixth most congested city in the country, the inner-city last-mile speed here is 10 mph.
5. Los Angeles
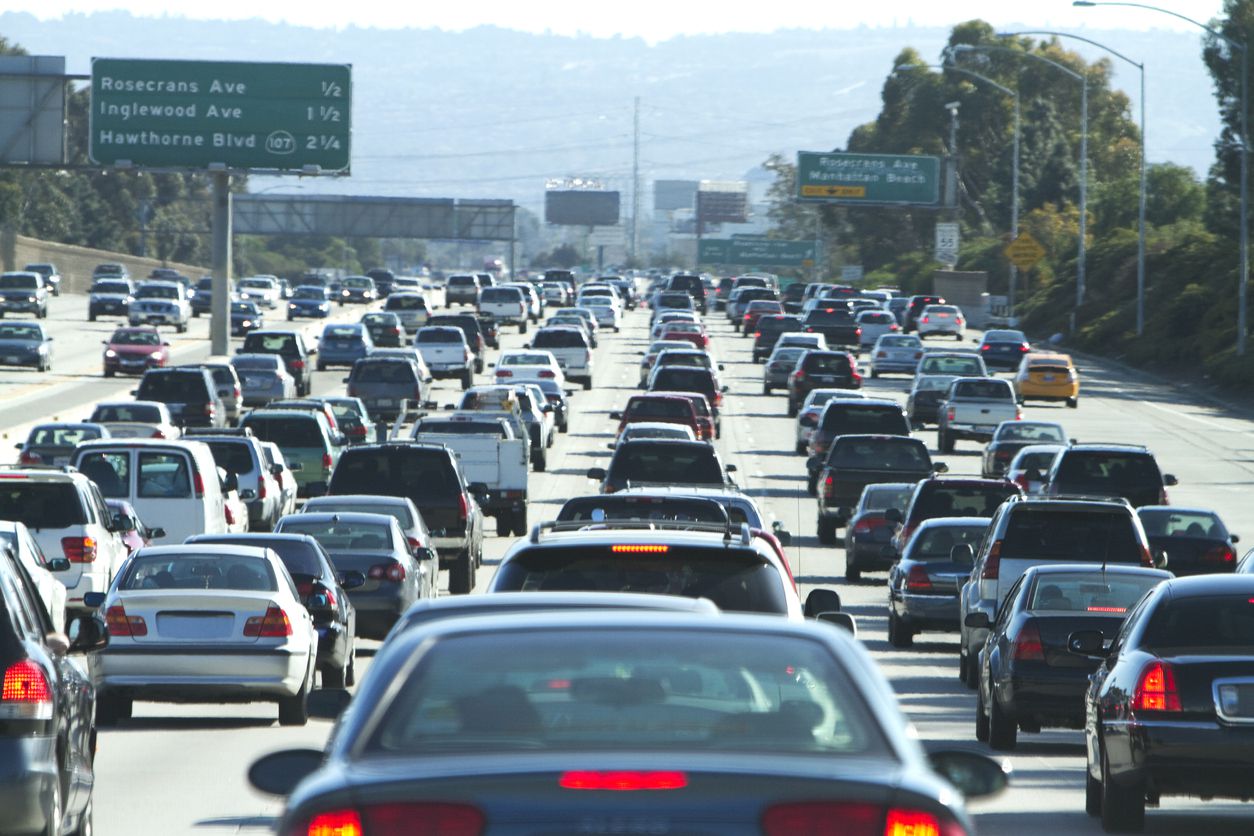
Hours lost in congestion: 128 Cost of congestion (per driver): $1,788 Los Angeles is legendary for its traffic woes, which makes it downright surprising that the city did not top this list. But it did come in fifth. According to the data, Los Angeles’ gridlock did not rank worse because the city has such a sprawling geography and a massive road network, which eases some of its challenges. But Los Angeles is home to the fourth most congested road in the country. You’ll want to avoid the I-10 freeway in Los Angeles between the I-405 and the I-110, where the average daily delay is 19 minutes.
4. New York
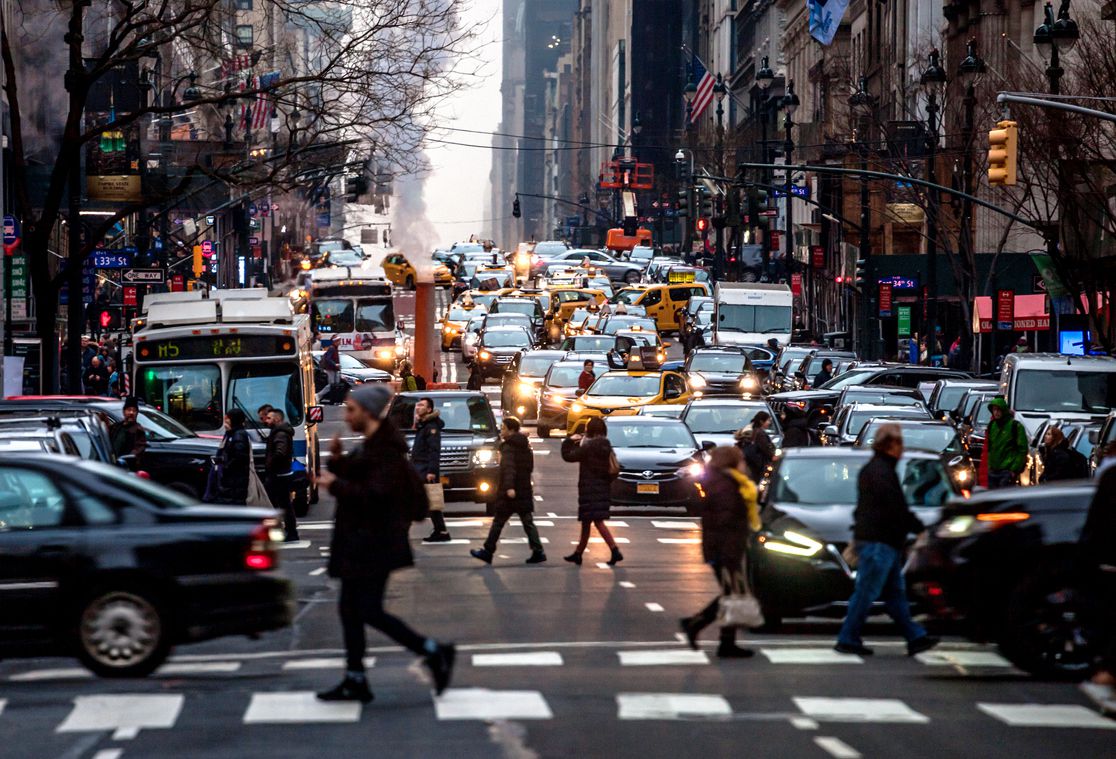
Hours lost in congestion: 133 Cost of congestion (per driver): $1,859 In addition to being congested, New York City is the slowest U.S. city with last-mile speeds of 9 mph. In other words, it’s faster to bike than drive or take the bus, according to the report. What’s more, for four years in a row, the Cross Bronx Expressway (I-95) in New York City has topped the INRIX list of worst corridors with drivers wasting a total of 114 hours per year at peak hours in congestion.
3. Chicago
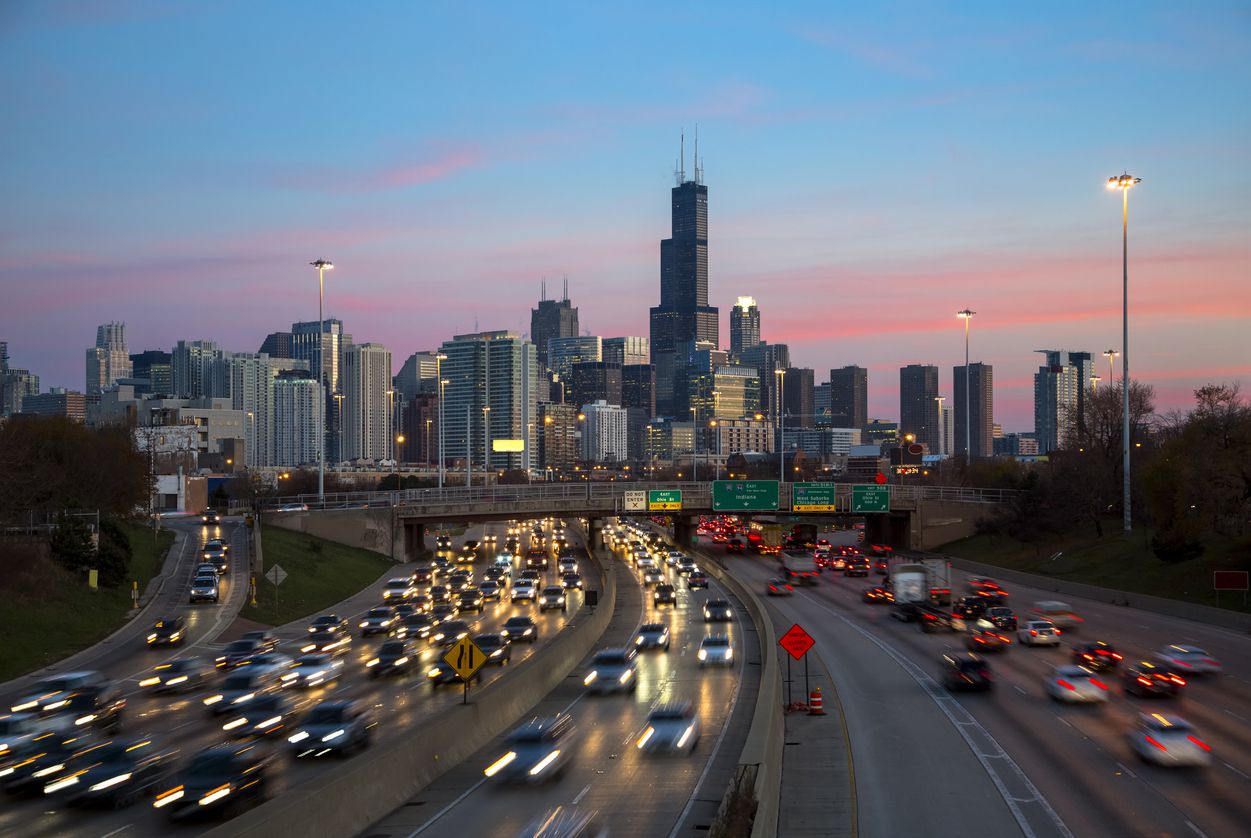
Hours lost in congestion: 138 Cost of congestion (per driver): $1,920 Chicago is home to the second most congested road in the United States: the I-94/I-90. It is most severely backed up between Stevenson Expressway and I-294, where the average delay is 26 minutes. Chicago is also the location of the third most congested road in the country, the I-290 (Eisenhower Expressway). The average delay on this road is 23 minutes between I-94 and I-294.
2. Washington, D.C.
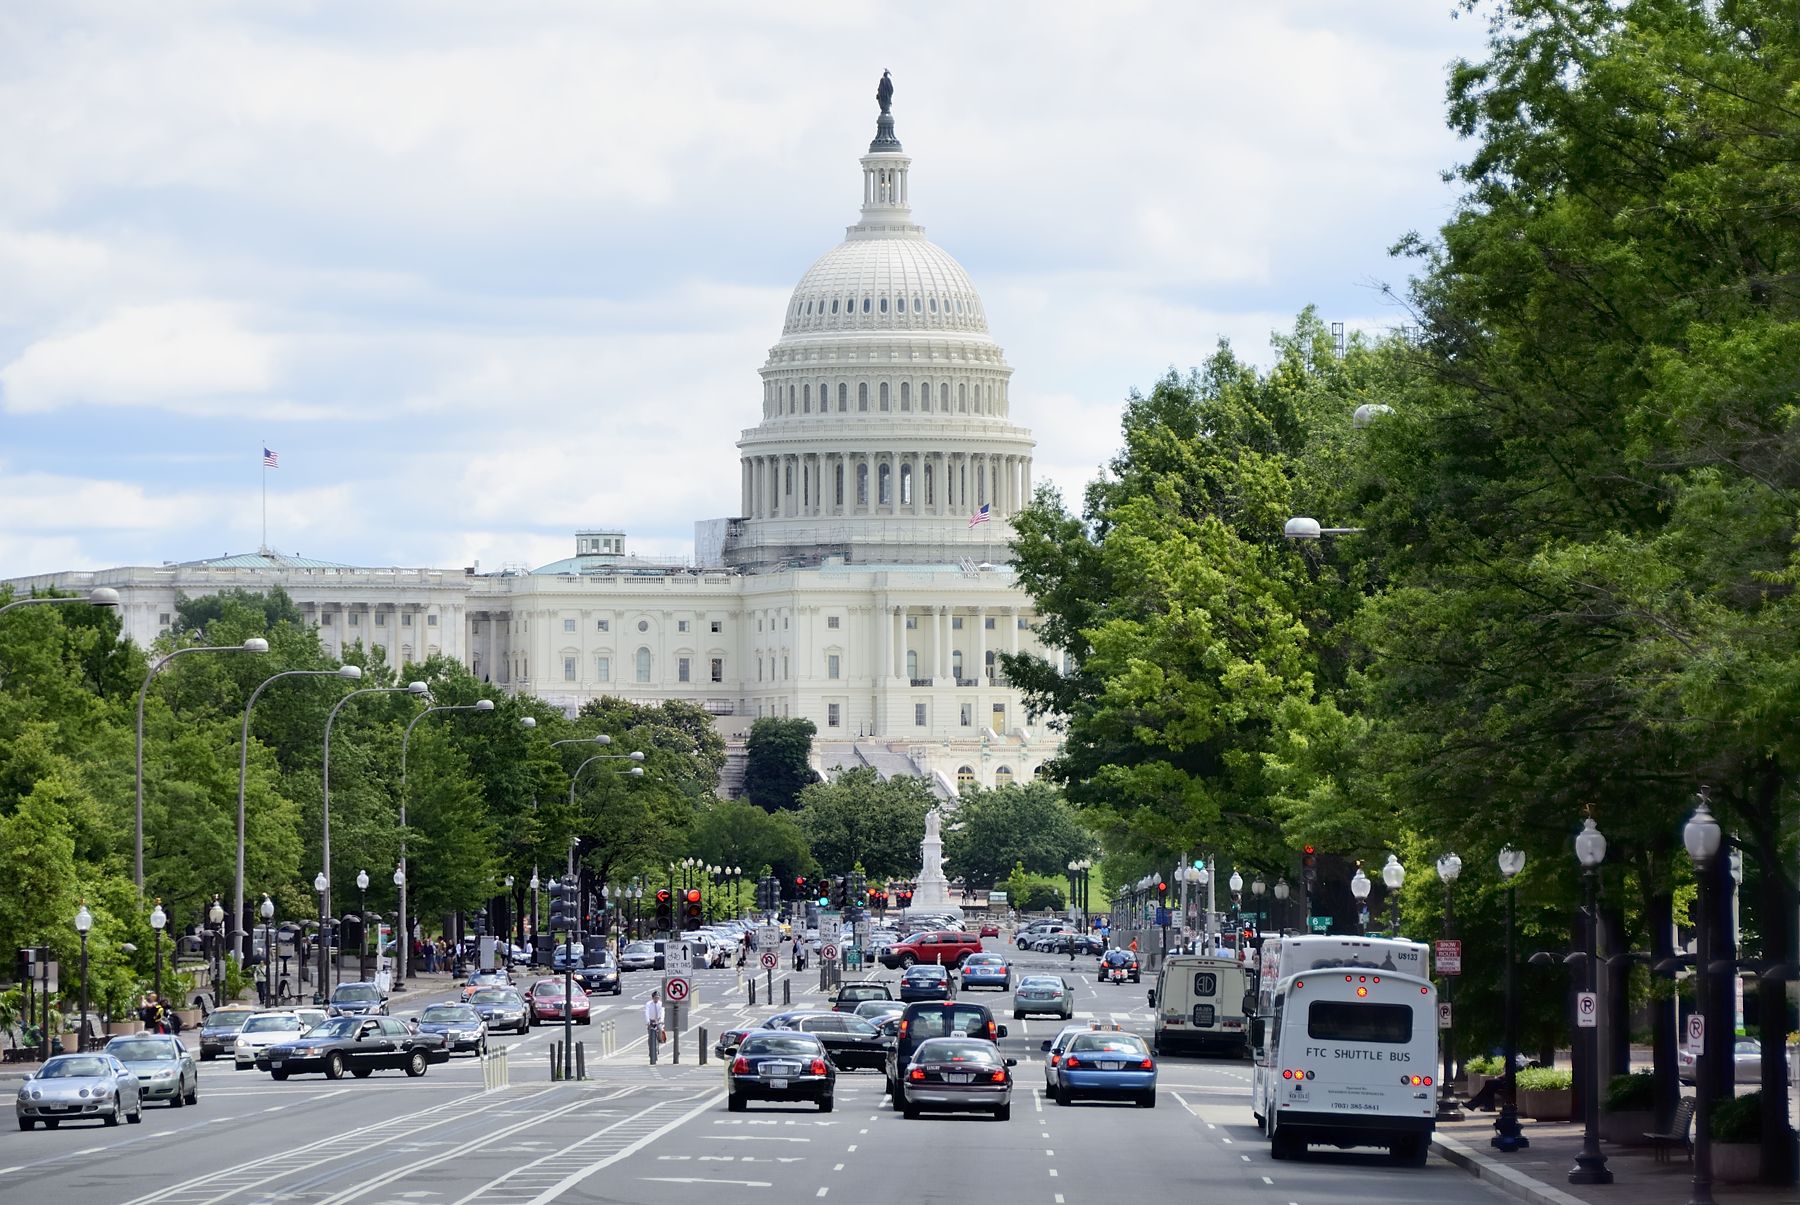
Hours lost in congestion: 155 Cost of congestion (per driver): $2,161 The good news for Washington, D.C., is that congestion has decreased 3% year over year. The bad news is that it’s still the second most congested city in the country. Well, that and the city is also the location of non-stop political drama.
1. Boston
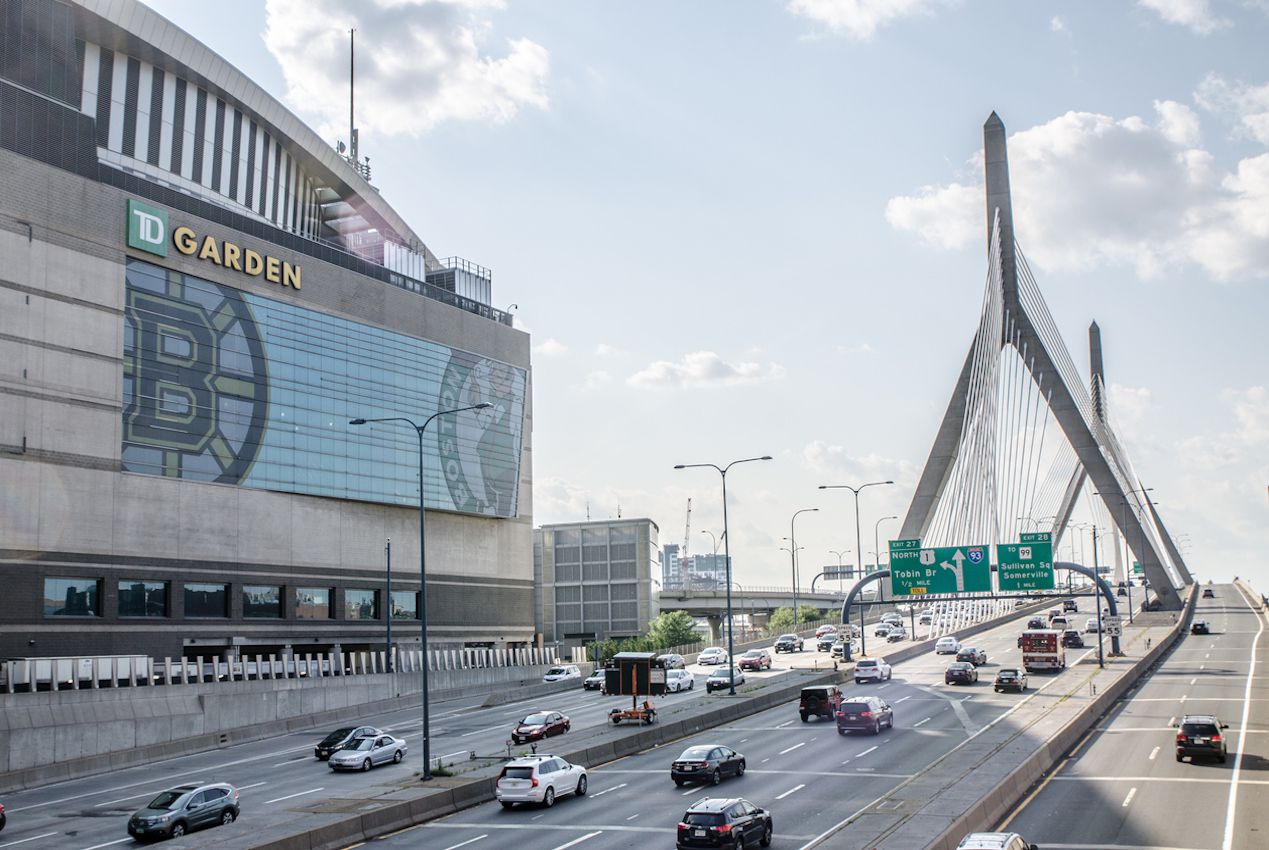
Hours lost in congestion: 164 Cost of congestion (per driver): $2,291 The worst city in the country for congestion is none other than Boston. Residents of Beantown experienced the highest costs linked to congested roads at nearly $2,300 a year. It’s also interesting to note that Boston was the only U.S. city whose congestion is so bad that it ranks among the 10 most congested cities worldwide. Bostonians clearly need to use more public transportation.