For some people, COVID-19 means working remotely and driving less, but for others it means driving more out of fear of public transportation or taking a car service — and now 20% of people without cars are suddenly considering buying one, WalletHub finds. Owning a car can be a major hassle and expense, but some cities make it easier than others. WalletHub ranked 100 major metropolitan areas based on 31 indicators of “driver-friendliness” such as average gas prices, annual hours spent in traffic congestion per commuter, and number of auto repair shops per capita. Here are its 10 best and worst cities for drivers, with a breakdown of rankings on some key measures. (The lower the rank, the worse the situation.)
Related: 16 Ways Driving Has Changed in the Past 50 Years
10th Worst: Seattle
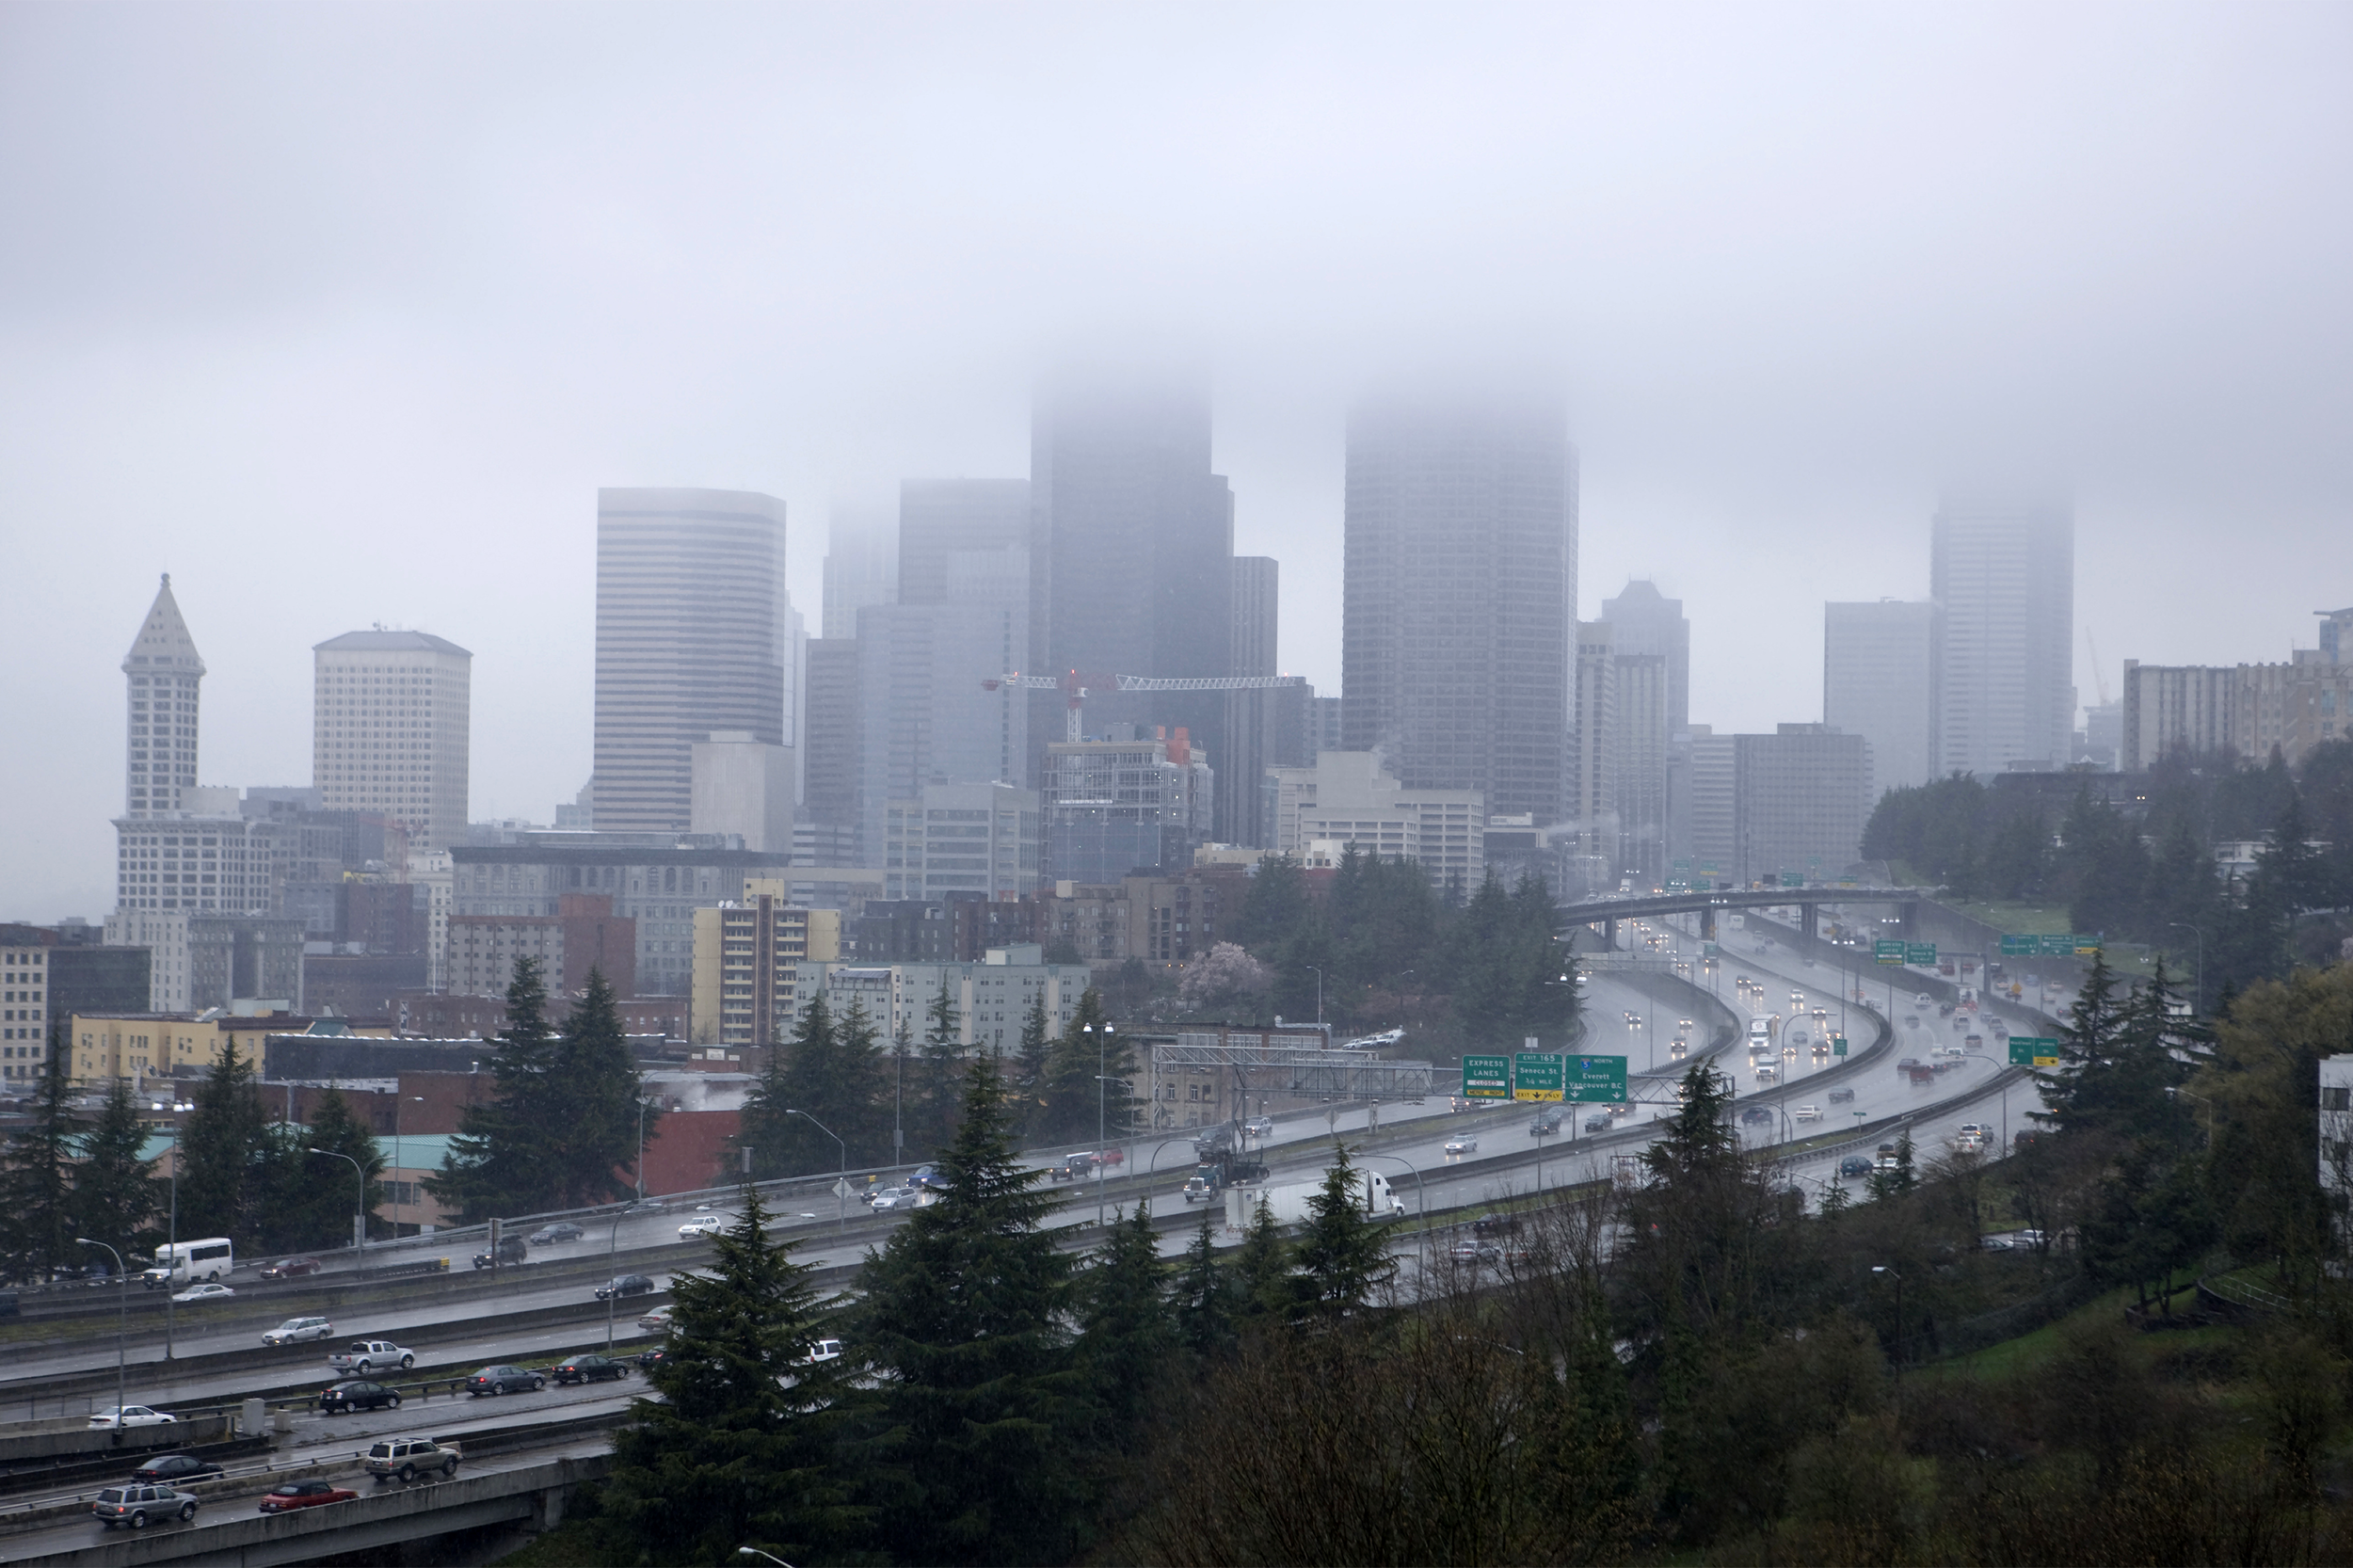
Cost of ownership and maintenance: 86th Traffic infrastructure: 84th Safety: 60th Access to vehicles and maintenance: 50th Don’t like driving in the rain? Seattle had the most days with precipitation (along with Pittsburgh; Cleveland; Buffalo, New York; and nearby Portland, Oregon). Seattle also had one of the five highest average auto maintenance costs.
Related: 32 Lies Your Mechanic Has Told You
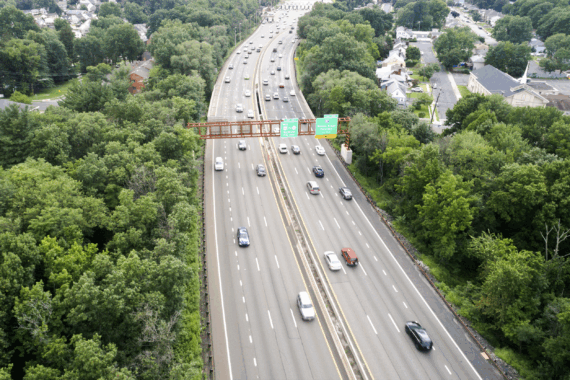
9th Worst: Newark, New Jersey
Cost of ownership and maintenance: 75th Traffic infrastructure: 98th Safety: 78th Access to vehicles and maintenance: 17th Keep your eyes open driving the 173-mile Garden State Parkway. According to the state’s Turnpike Authority, it had the most crashes last year of any highway in the state: 10,363, or 28 a day. And 22 were fatal.
8th Worst: San Bernardino, California
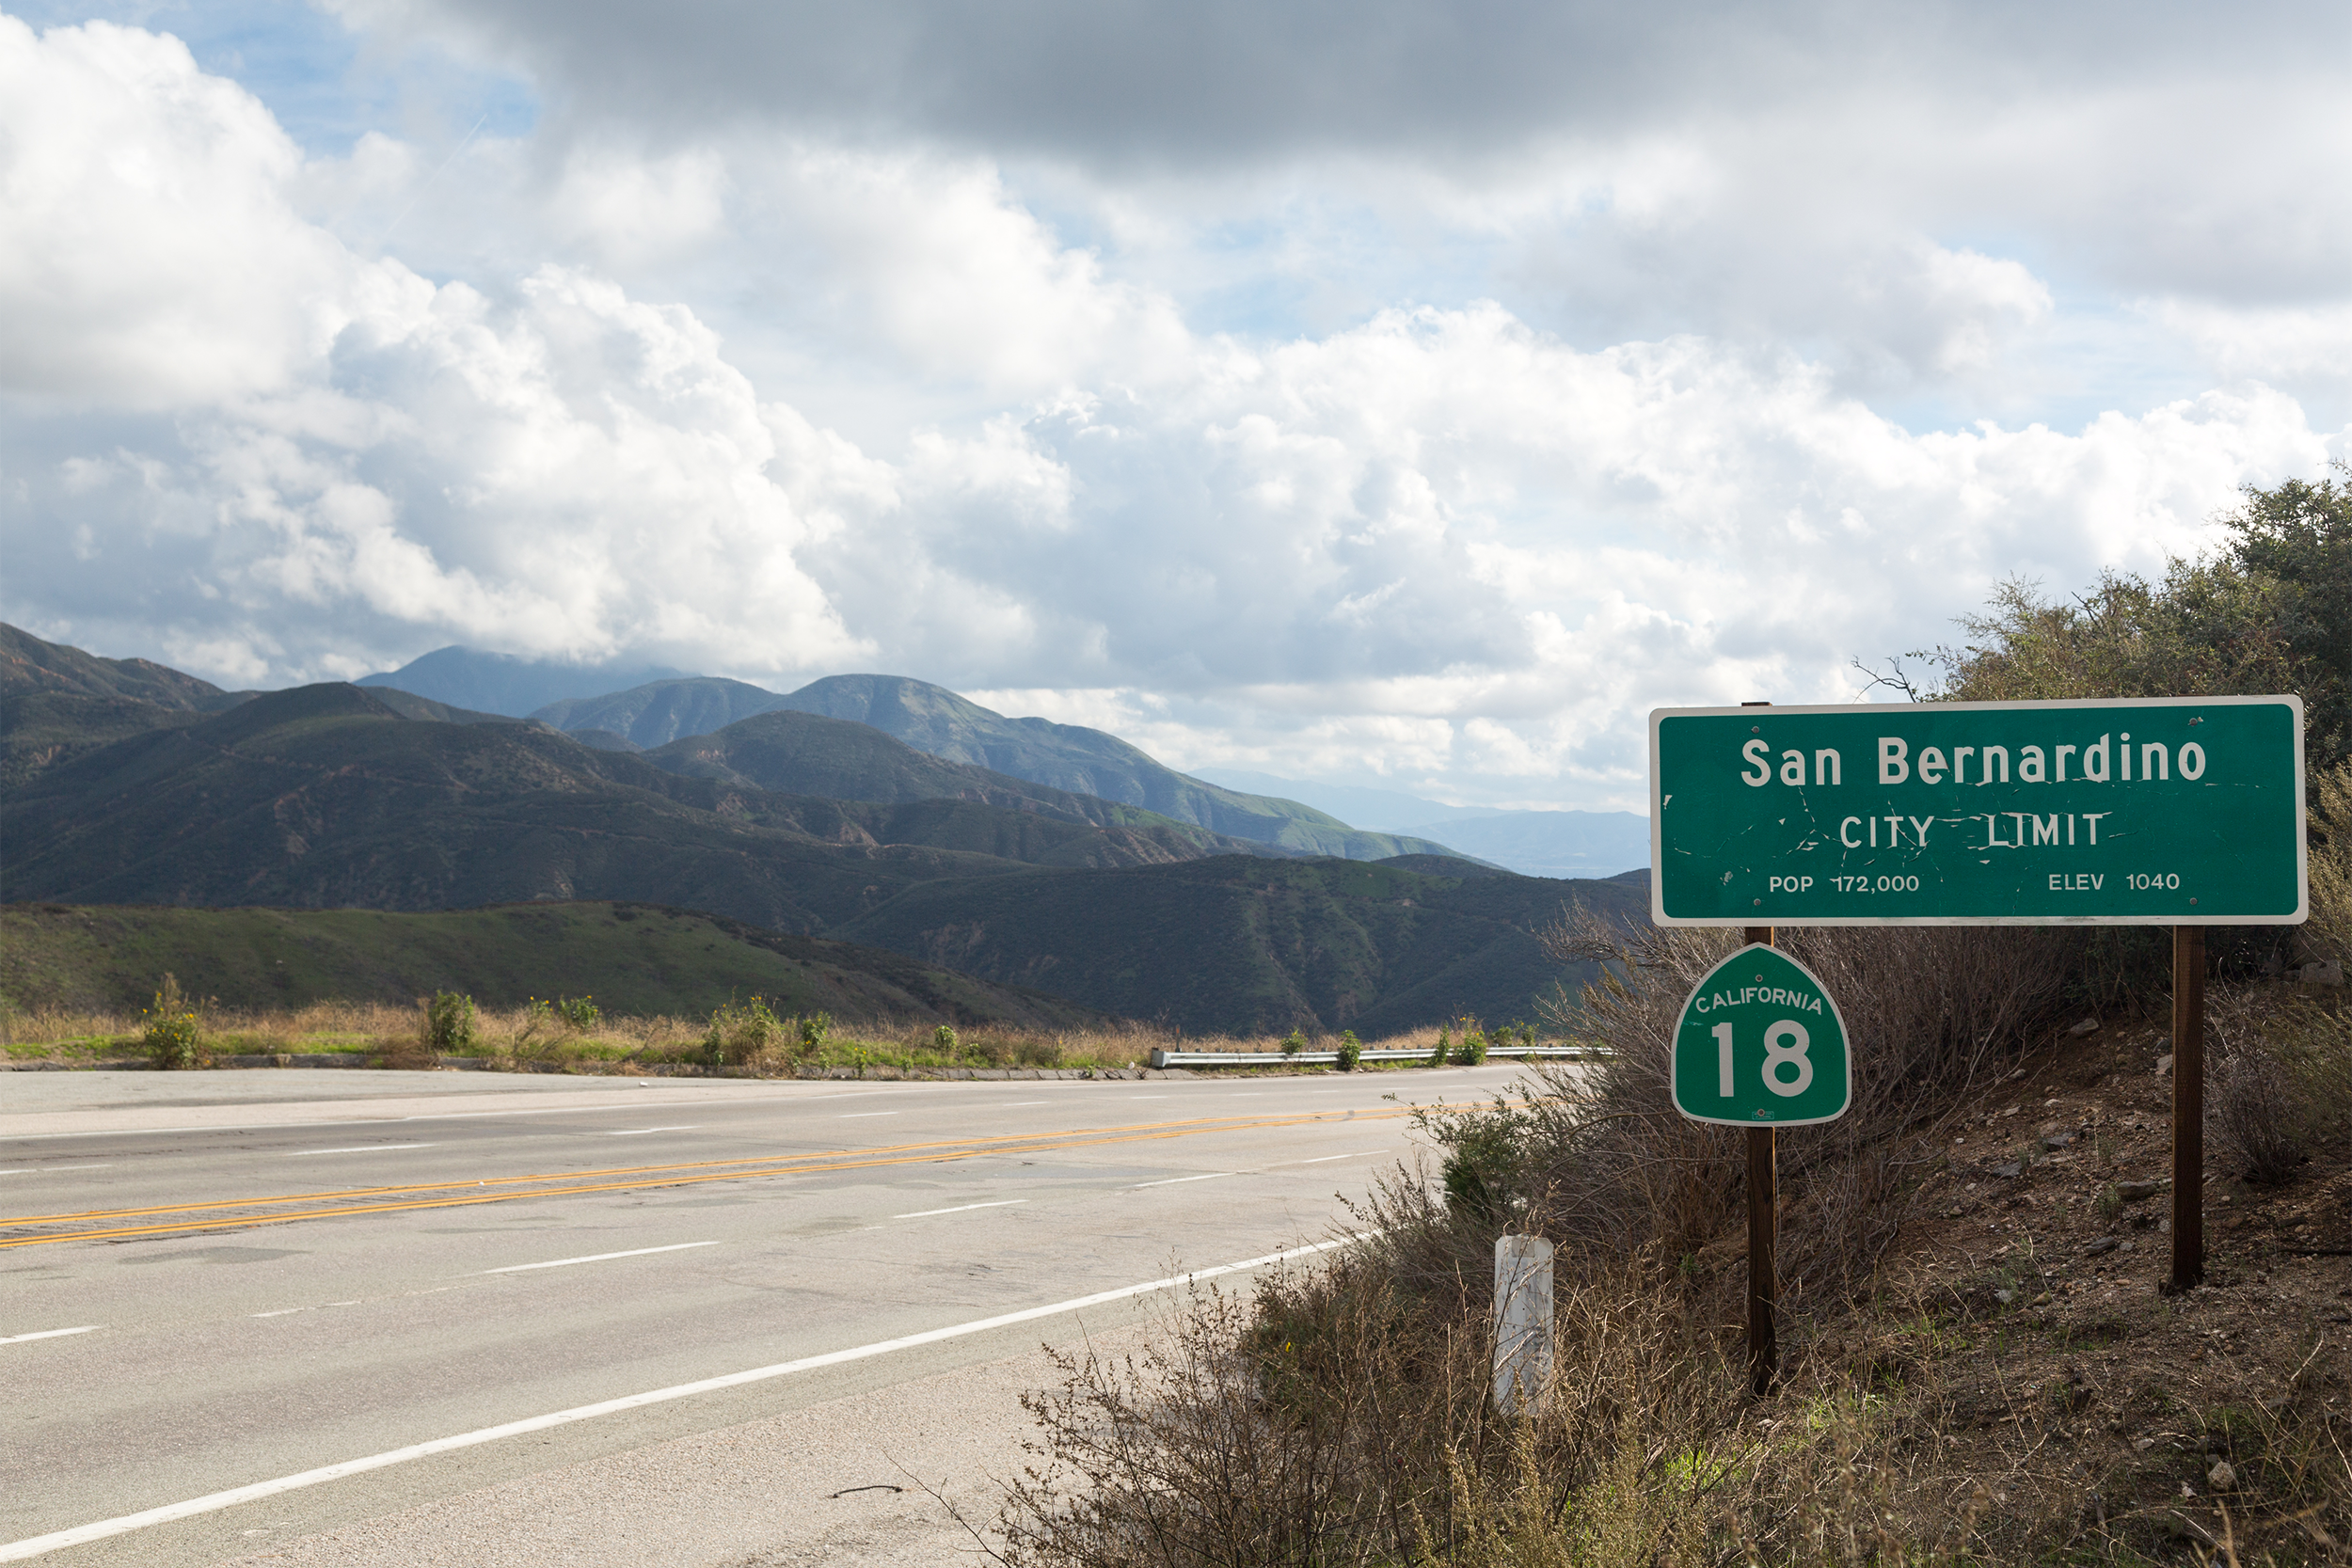
Cost of ownership and maintenance: 93rd Traffic infrastructure: 71stSafety: 70th Access to vehicles and maintenance: 72nd Eighth-worst is bad, but at least San Bernardino is in the top five for most auto repair shops per capita — though also for the most car thefts.
Related: 20 Cheap Ways to Protect Yourself From Thieves
7th Worst: Chicago
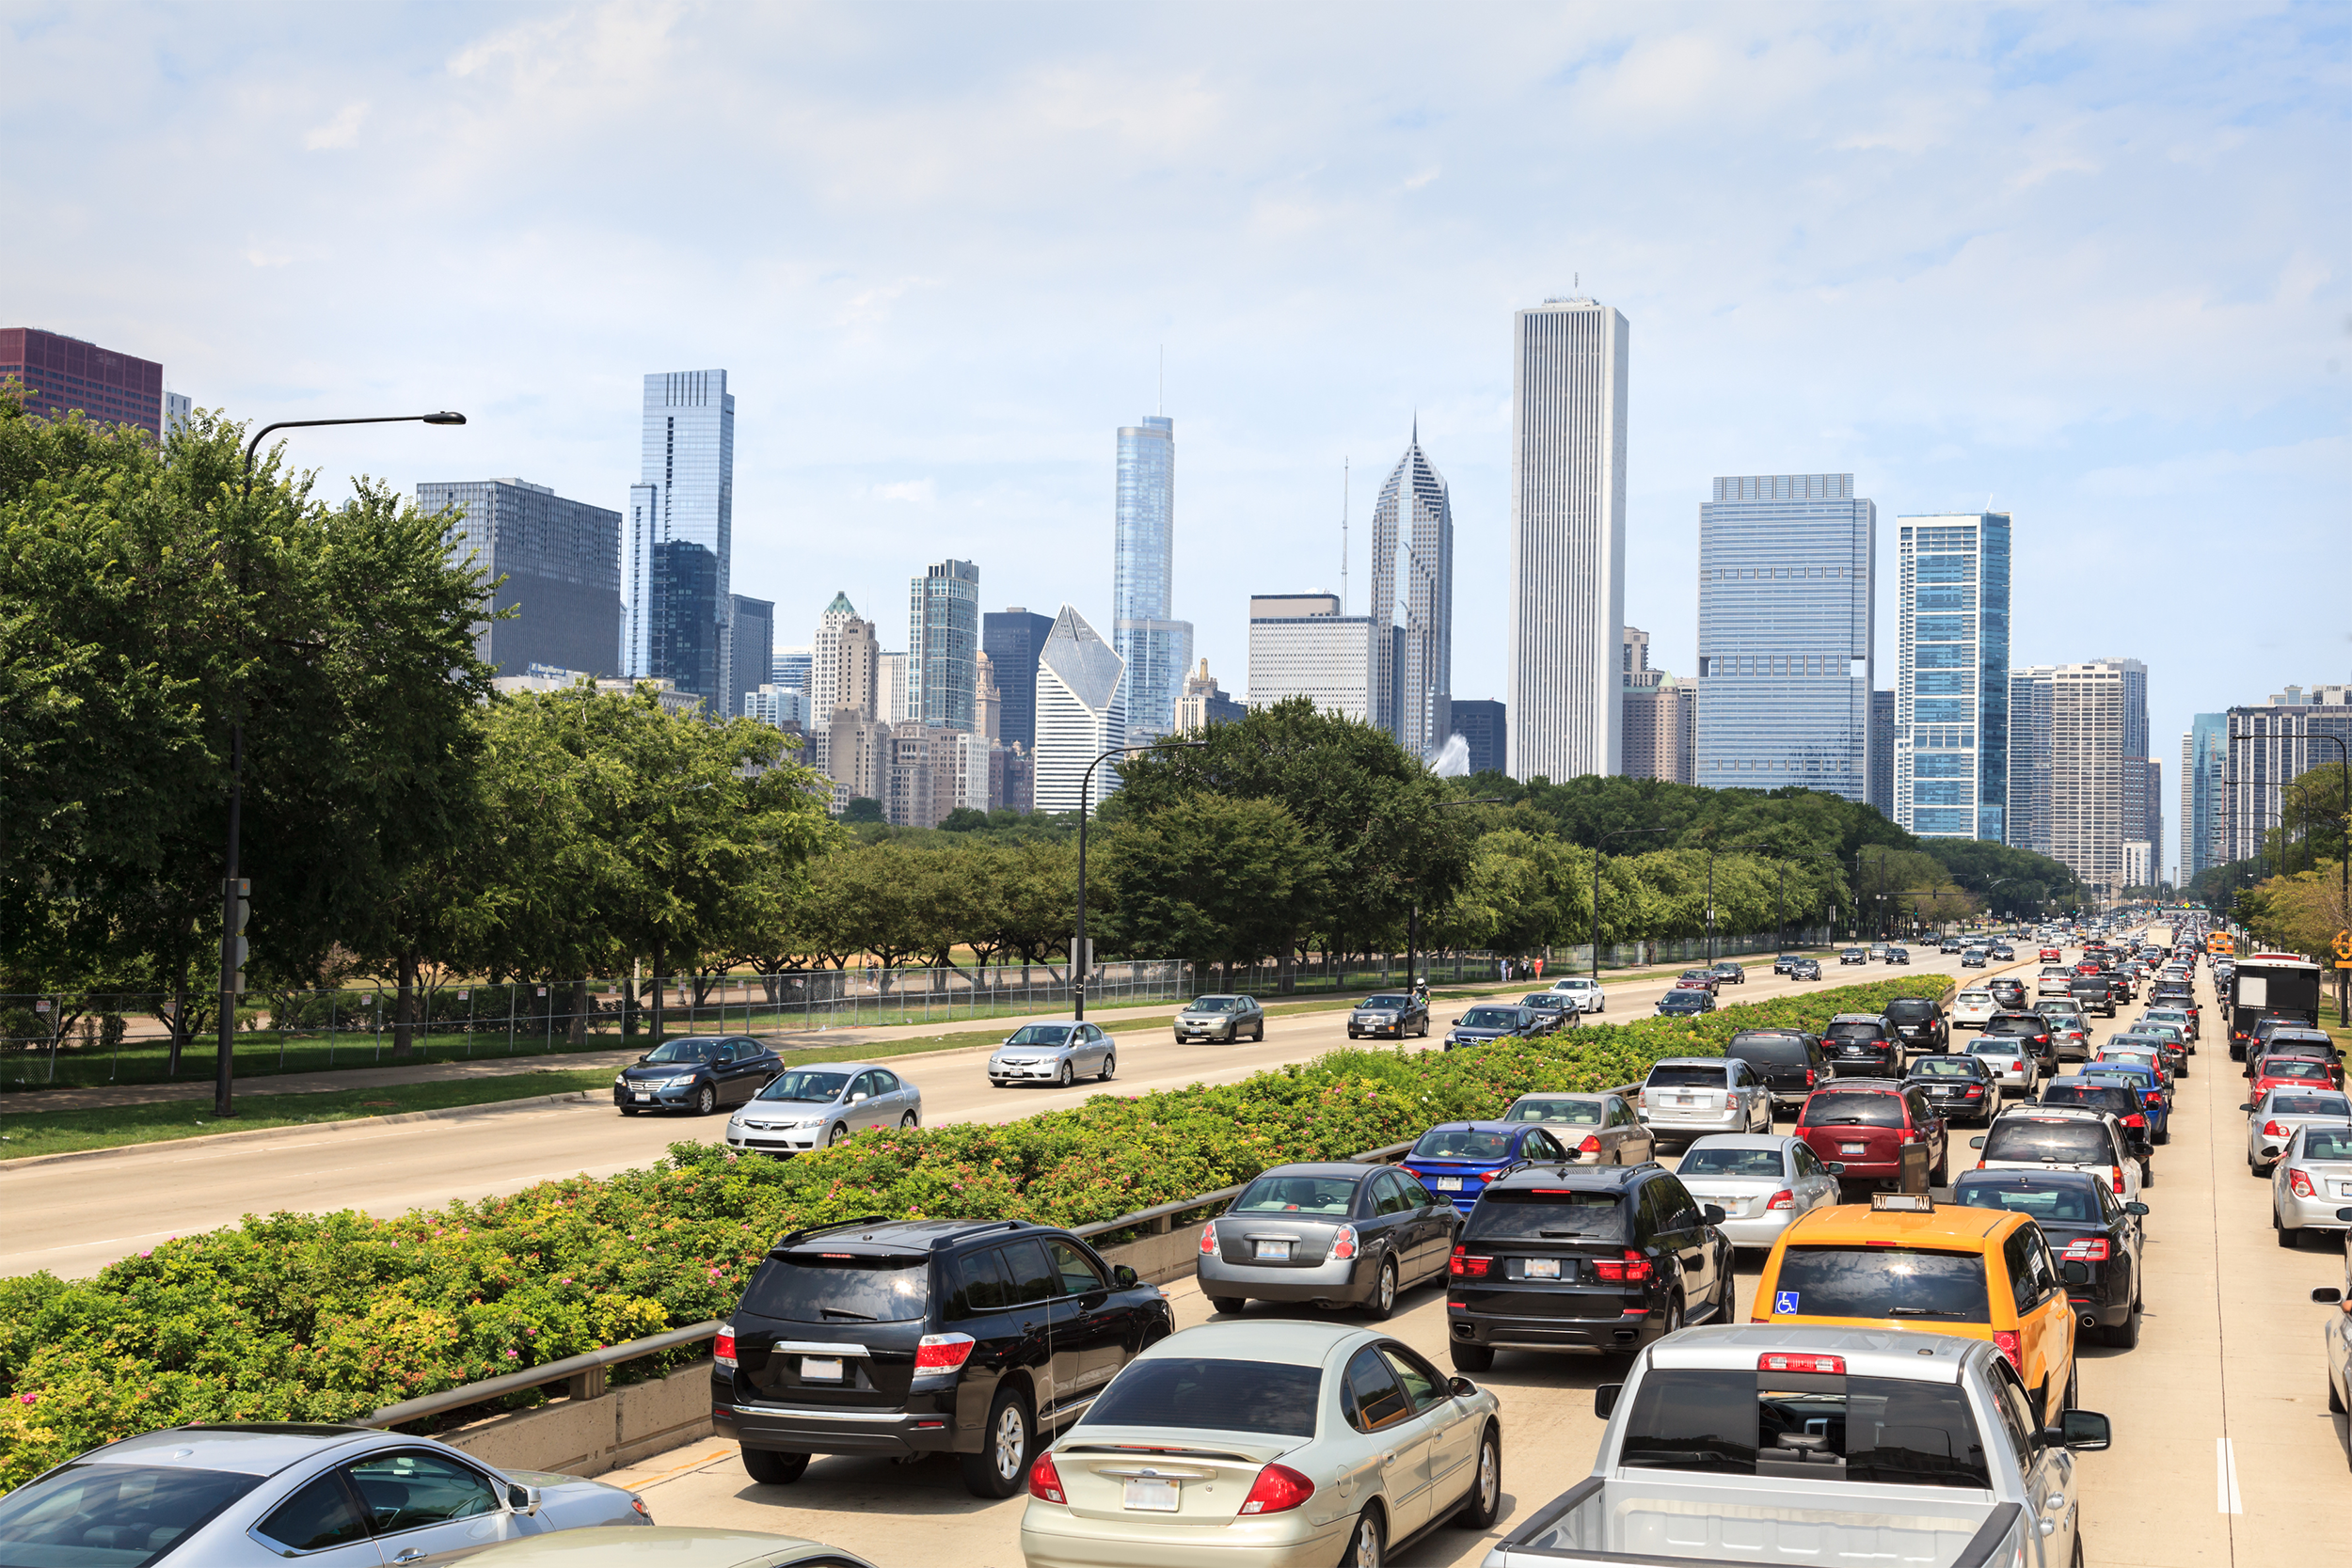
Cost of ownership and maintenance: 79th Traffic infrastructure: 99th Safety: 54th Access to vehicles and maintenance: 33rd Chicago is in the top five for most hours spent in traffic per commuter, and it has among the fewest auto repair shops if anything goes wrong on the road.
Related: 12 Ways to Stop Wasting Money on Your Car
6th Worst: Los Angeles
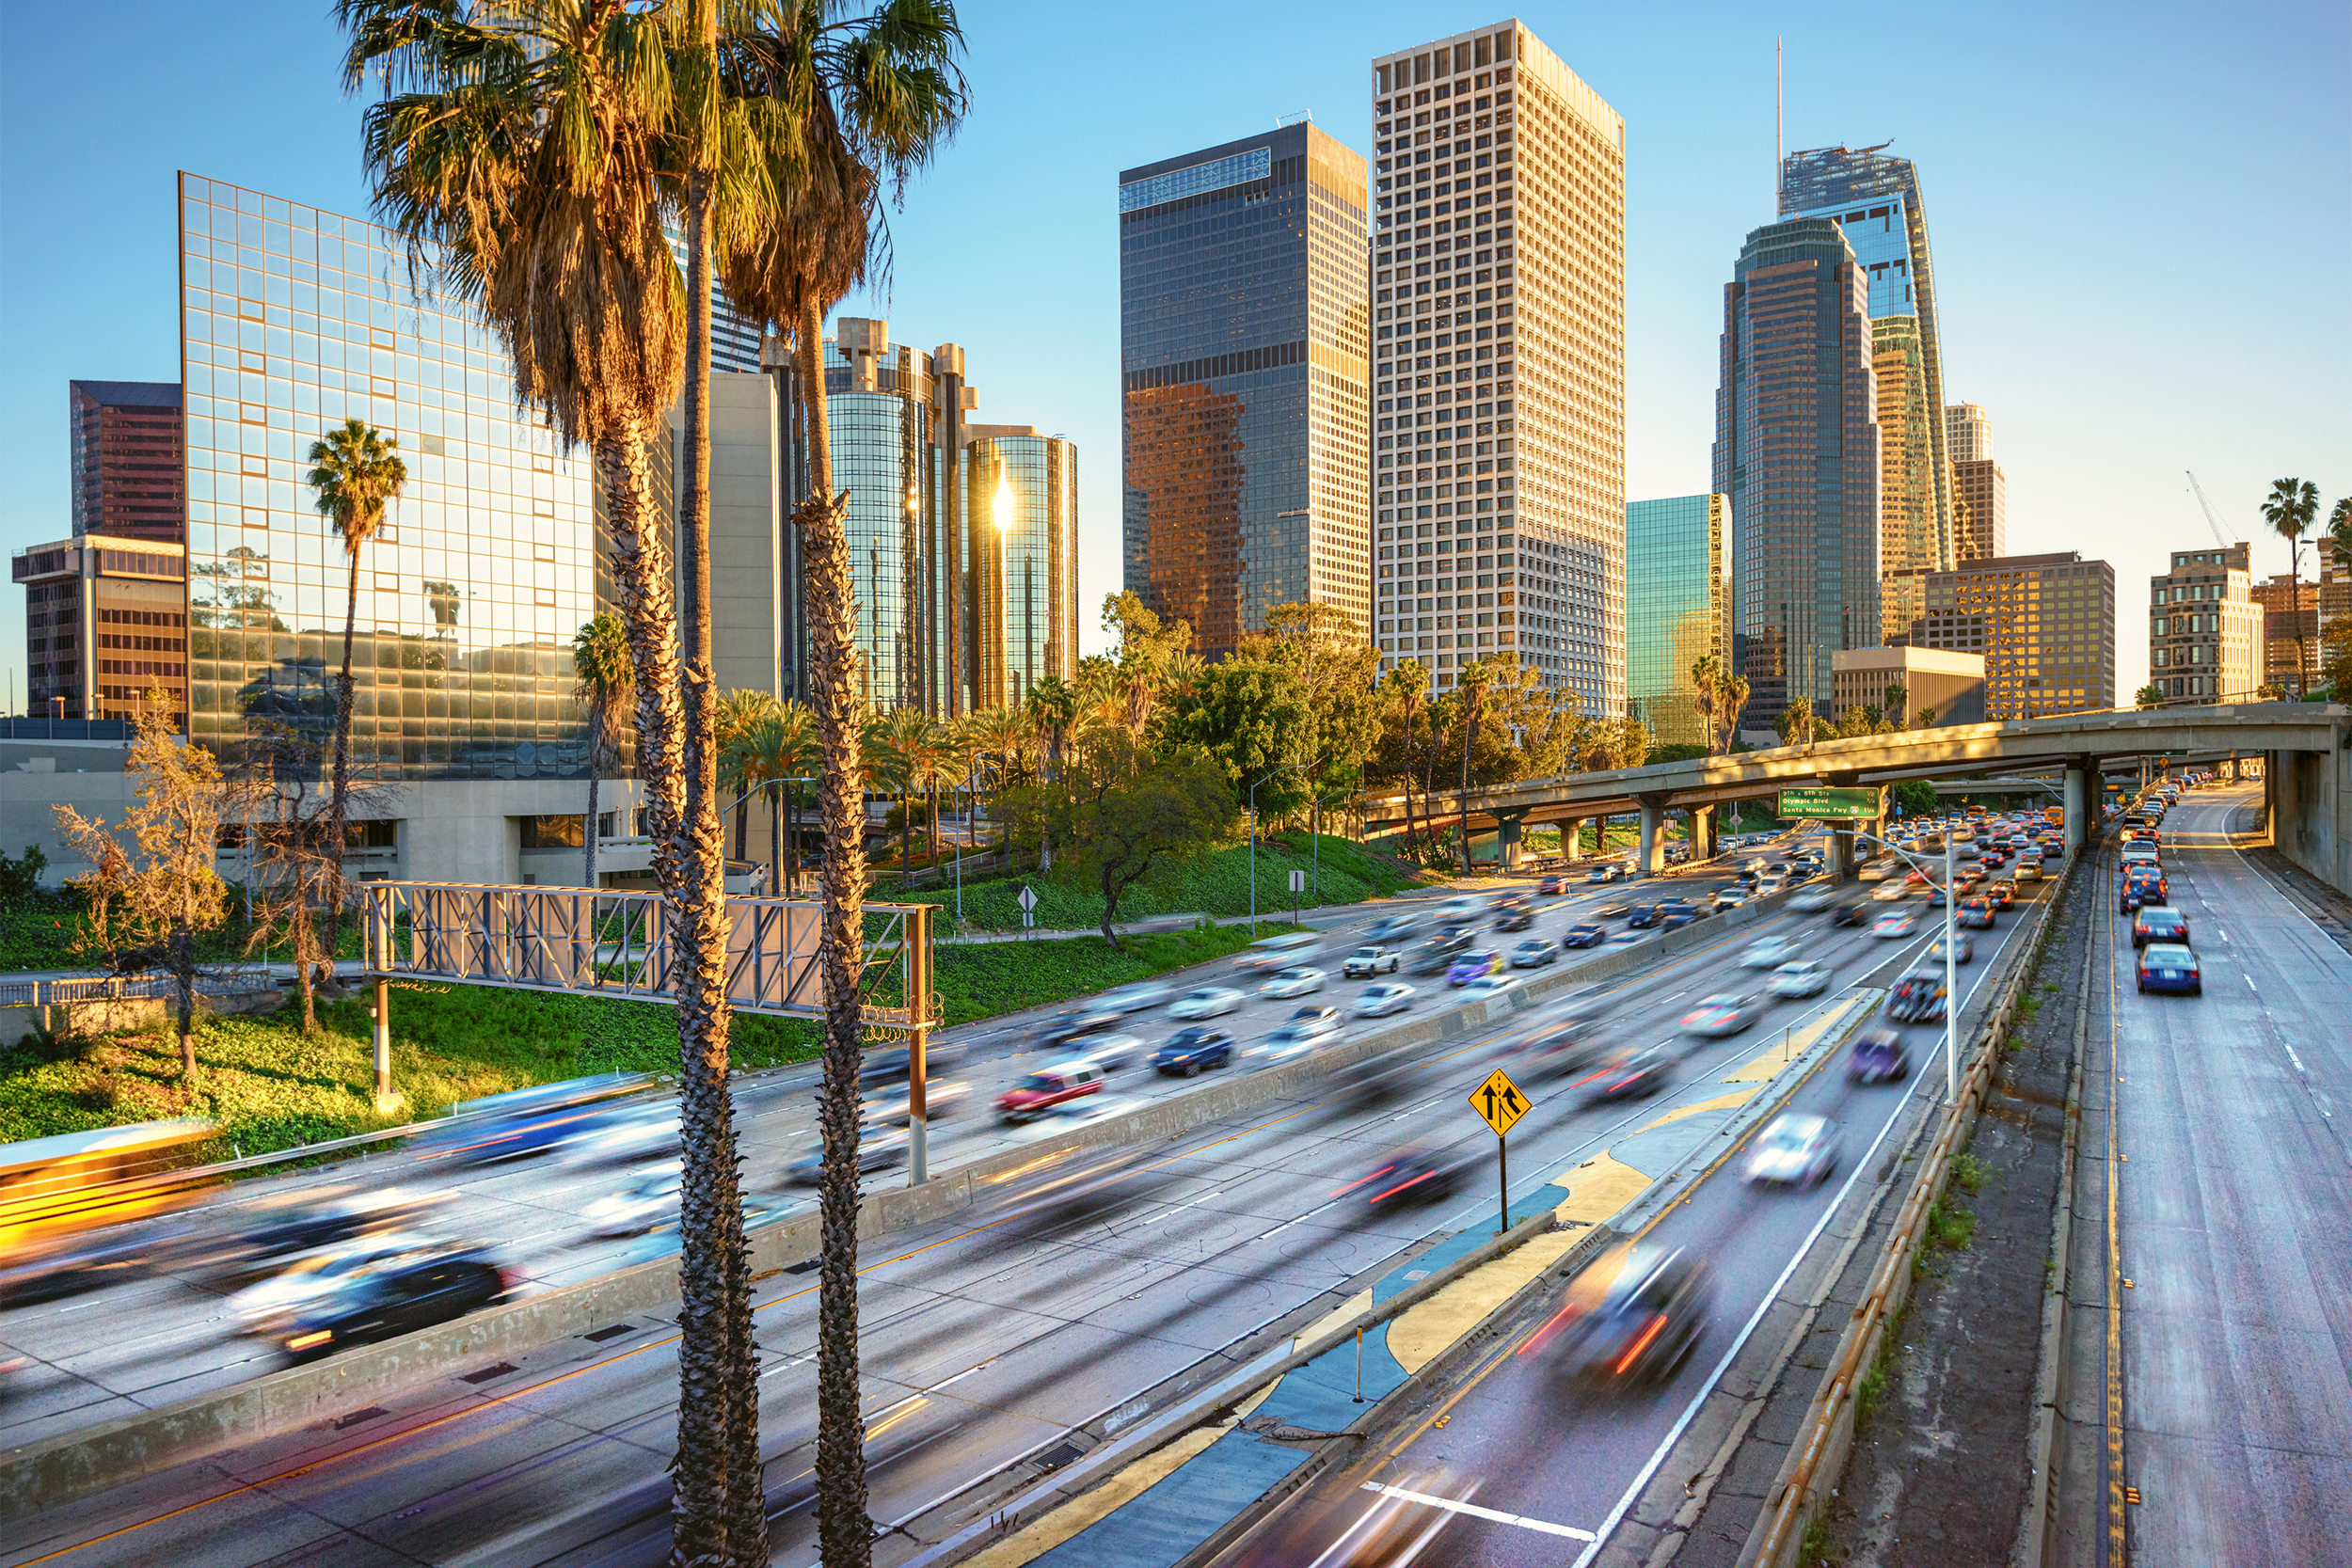
Cost of ownership and maintenance: 99th Traffic infrastructure: 89th Safety: 44th Access to vehicles and maintenance: 26th Drivers are more likely to get in an accident compared with the national average in Los Angeles than in almost any city in the country. And when you try to get your car fixed? Los Angeles is also in the top five for fewest auto repair shops.
Related: Save Money With Simple DIY Car Repairs
Trending on Cheapism


5th Worst: New York
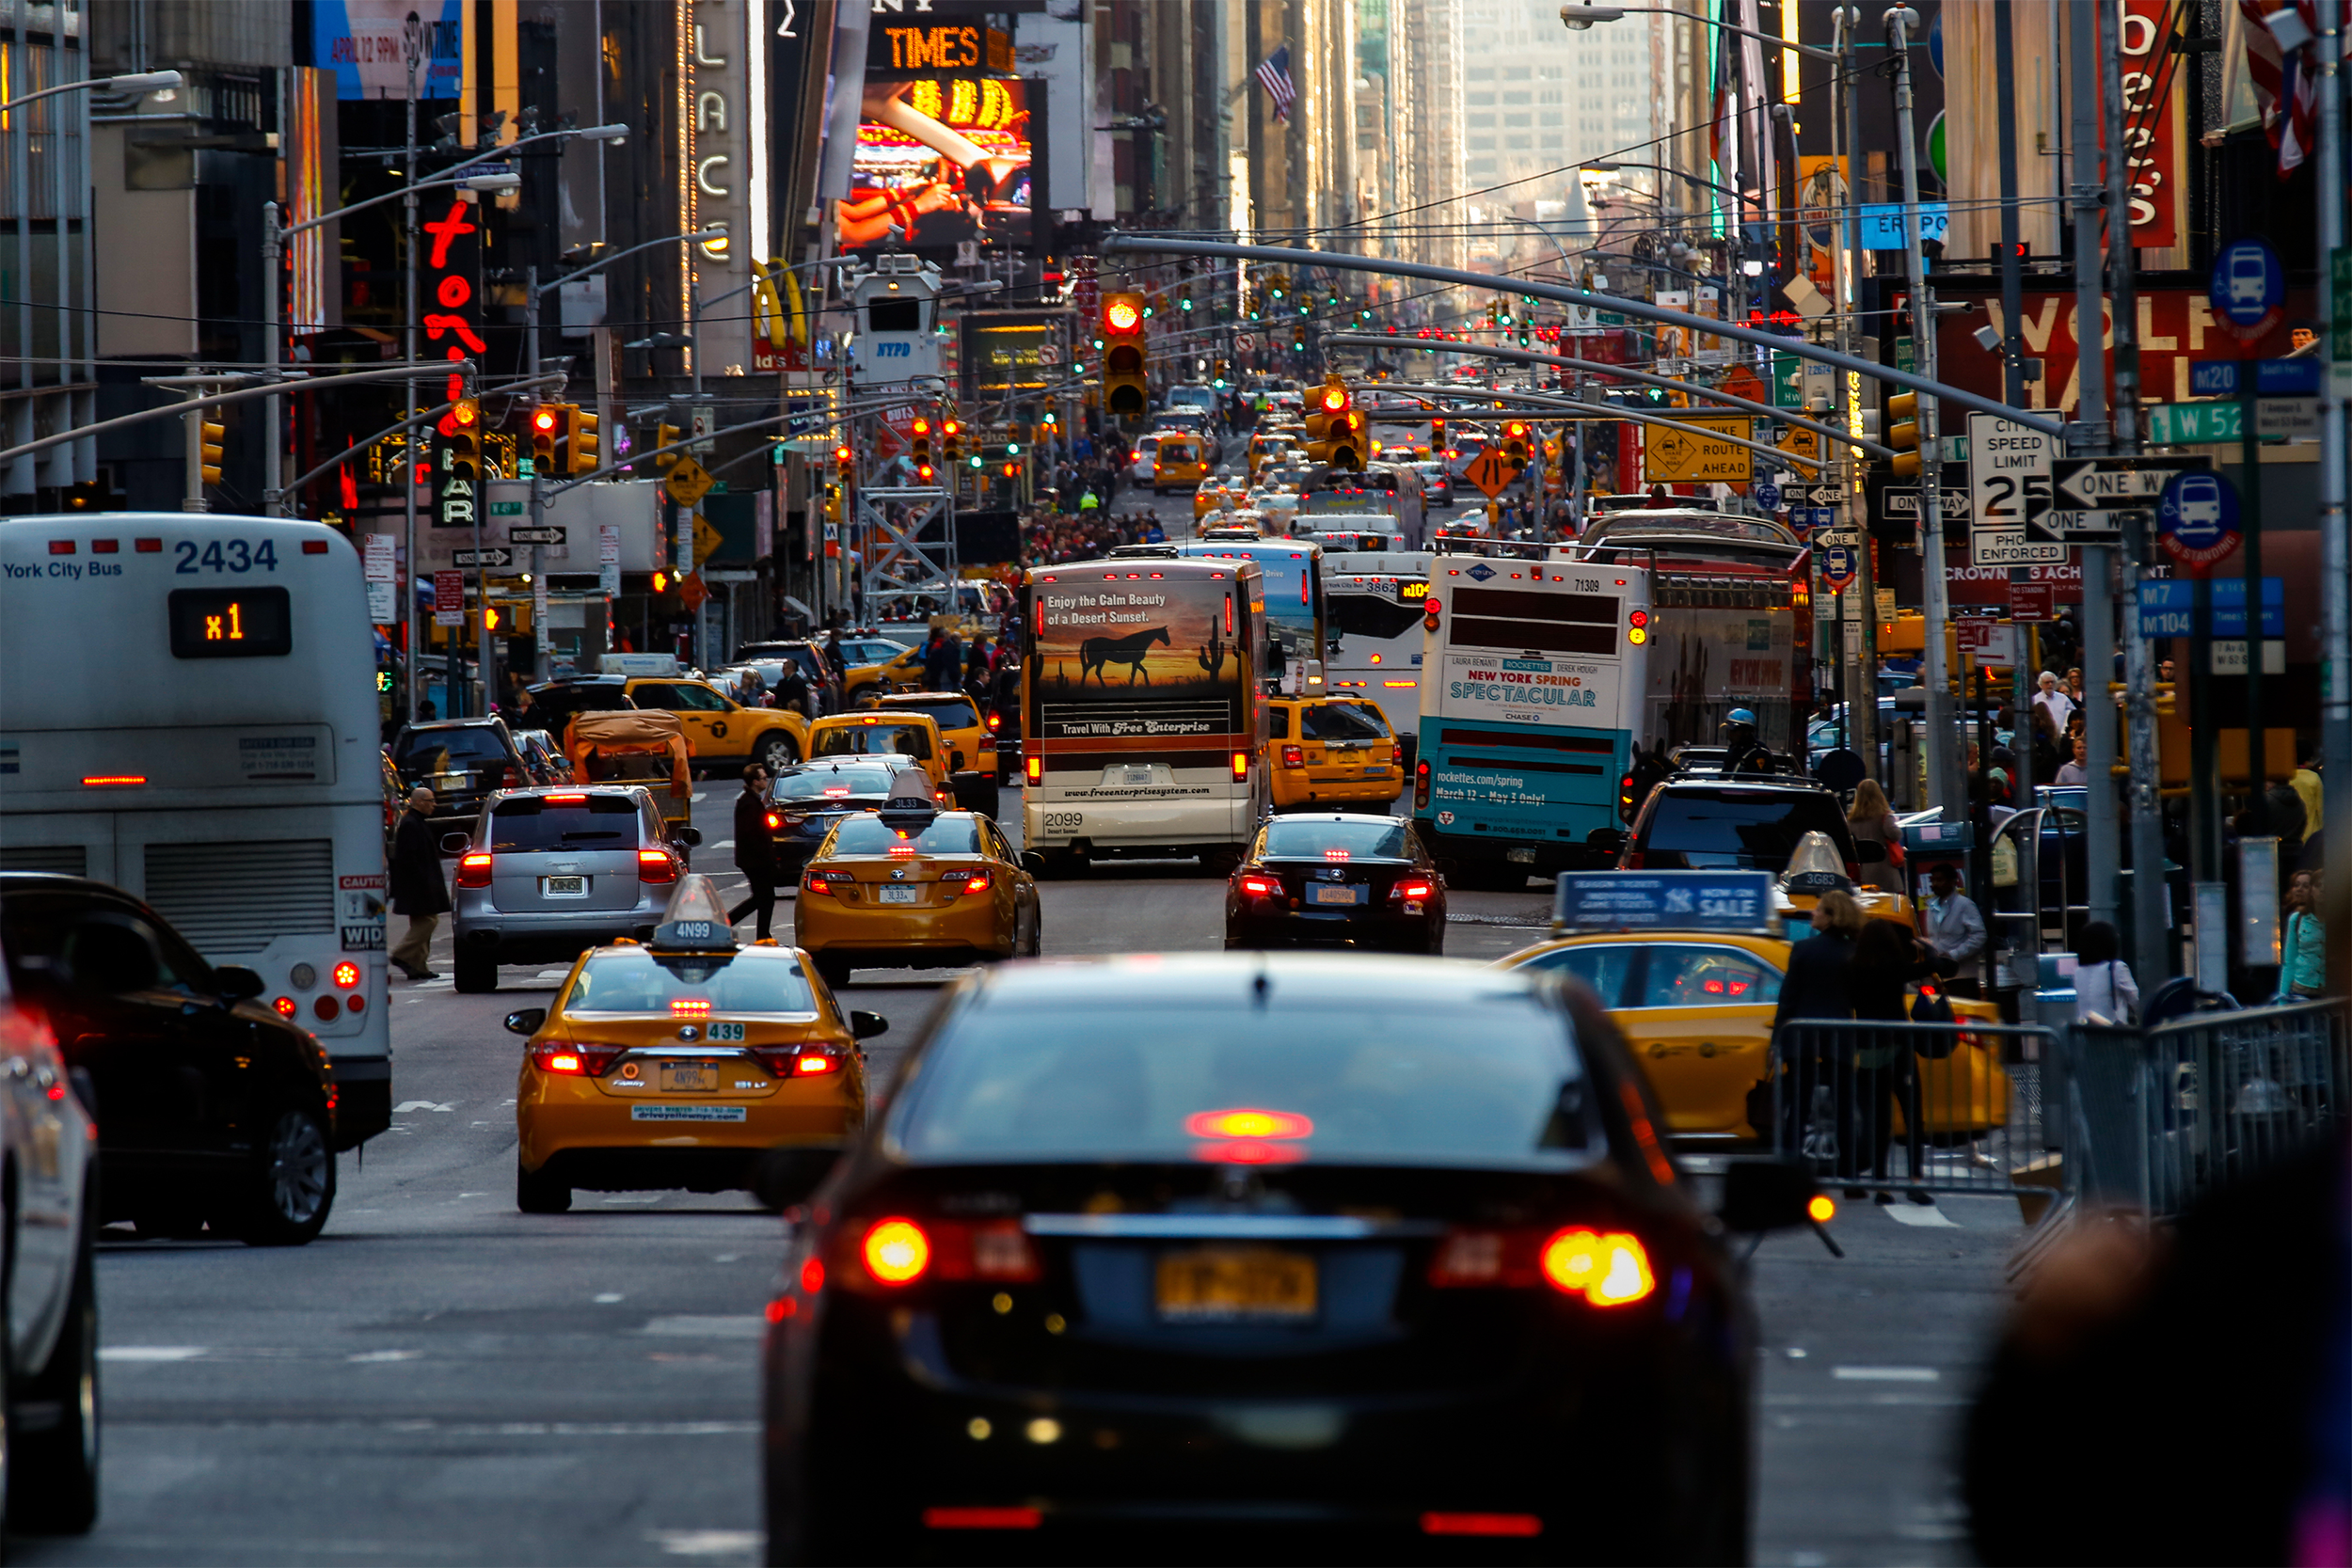
Cost of ownership and maintenance: 90th Traffic infrastructure: 100th Safety: 14th Access to vehicles and maintenance: 51st New York, New York — in the top five for time spent in traffic per commuter, fewest auto repair shops per capita, highest auto maintenance costs, and highest parking rates: around $40.07 for every two hours!
Related: 30 Most Congested Cities in America
4th Worst: Detroit
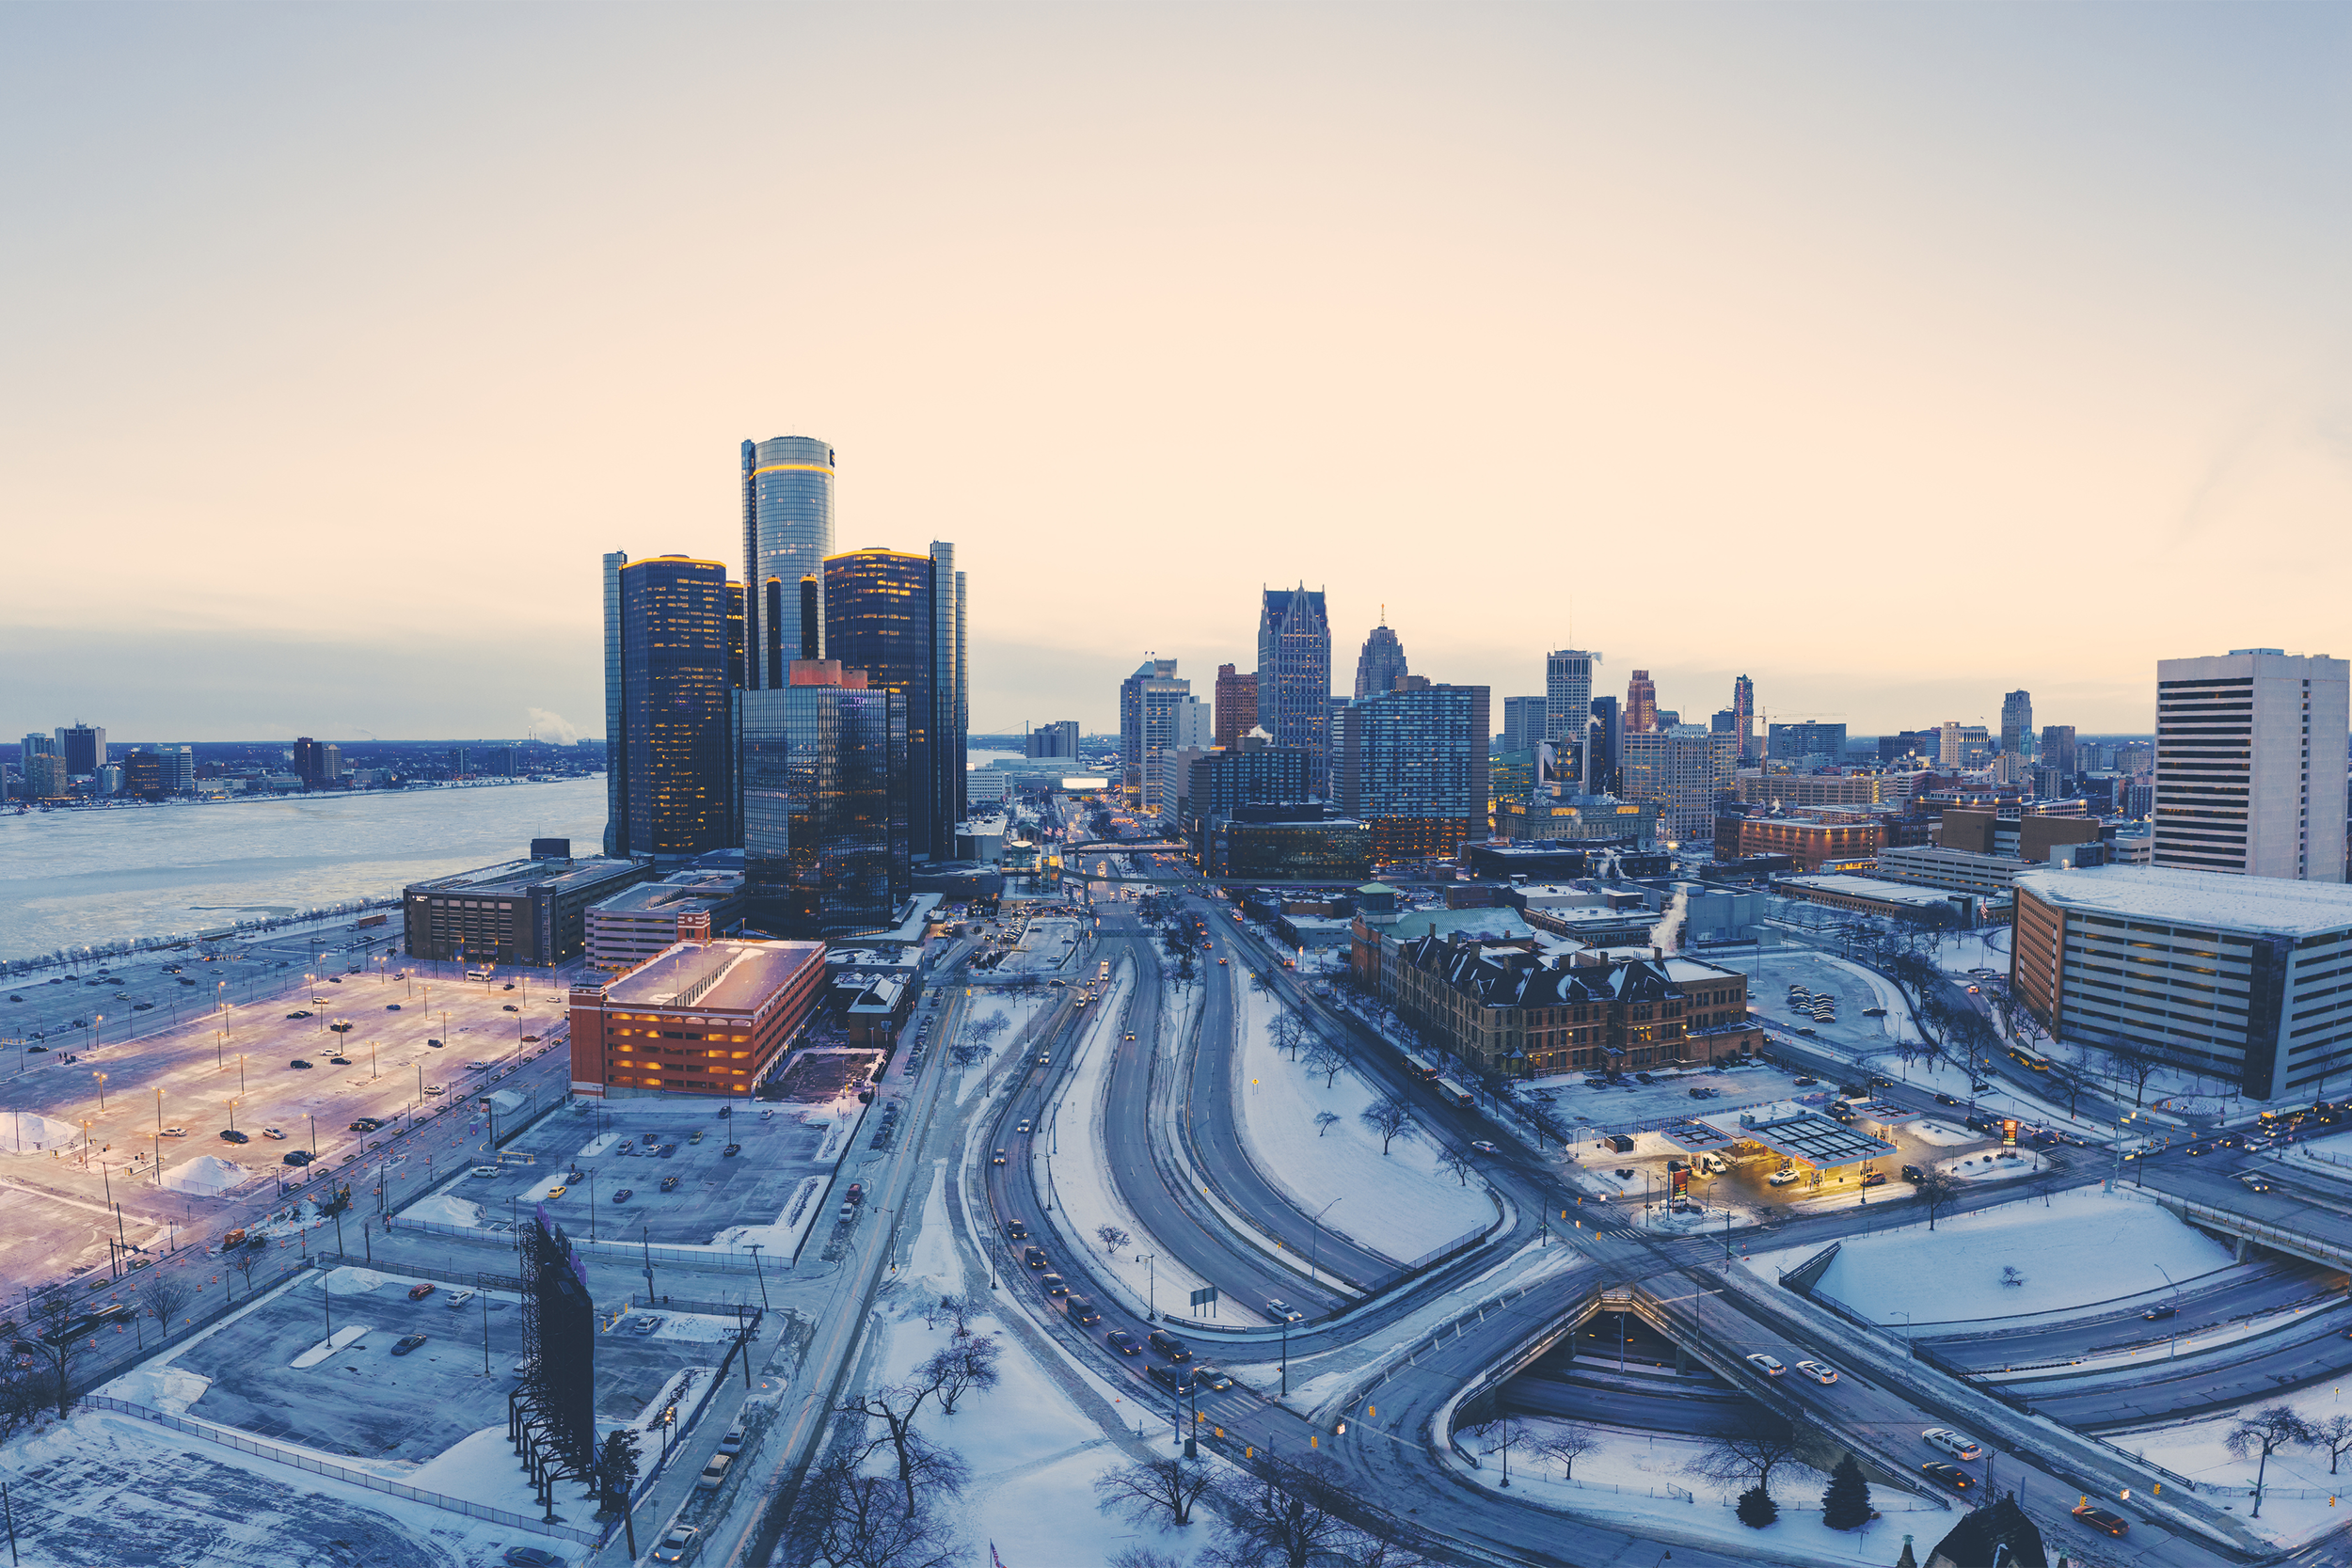
Cost of ownership and maintenance: 77th Traffic infrastructure: 93rd Safety: 98th Access to vehicles and maintenance: 53rd Michigan in general is considered the most dangerous state in the nation for winter driving, Detroit’s ABC affiliate reported, keeping in mind 2013’s record 42-car pileup on Detroit’s Interstate 75. Meanwhile, auto accident attorney Steven Gursten cites a 36% increase in hit-and-run incidents between 2014 to 2018, and notes that Detroit has the most uninsured drivers in the state, “with some estimates as high as 50% of all cars on the road uninsured.”
Related: 21 Things to Keep in Your Car for Safe Winter Driving
3rd Worst: San Francisco
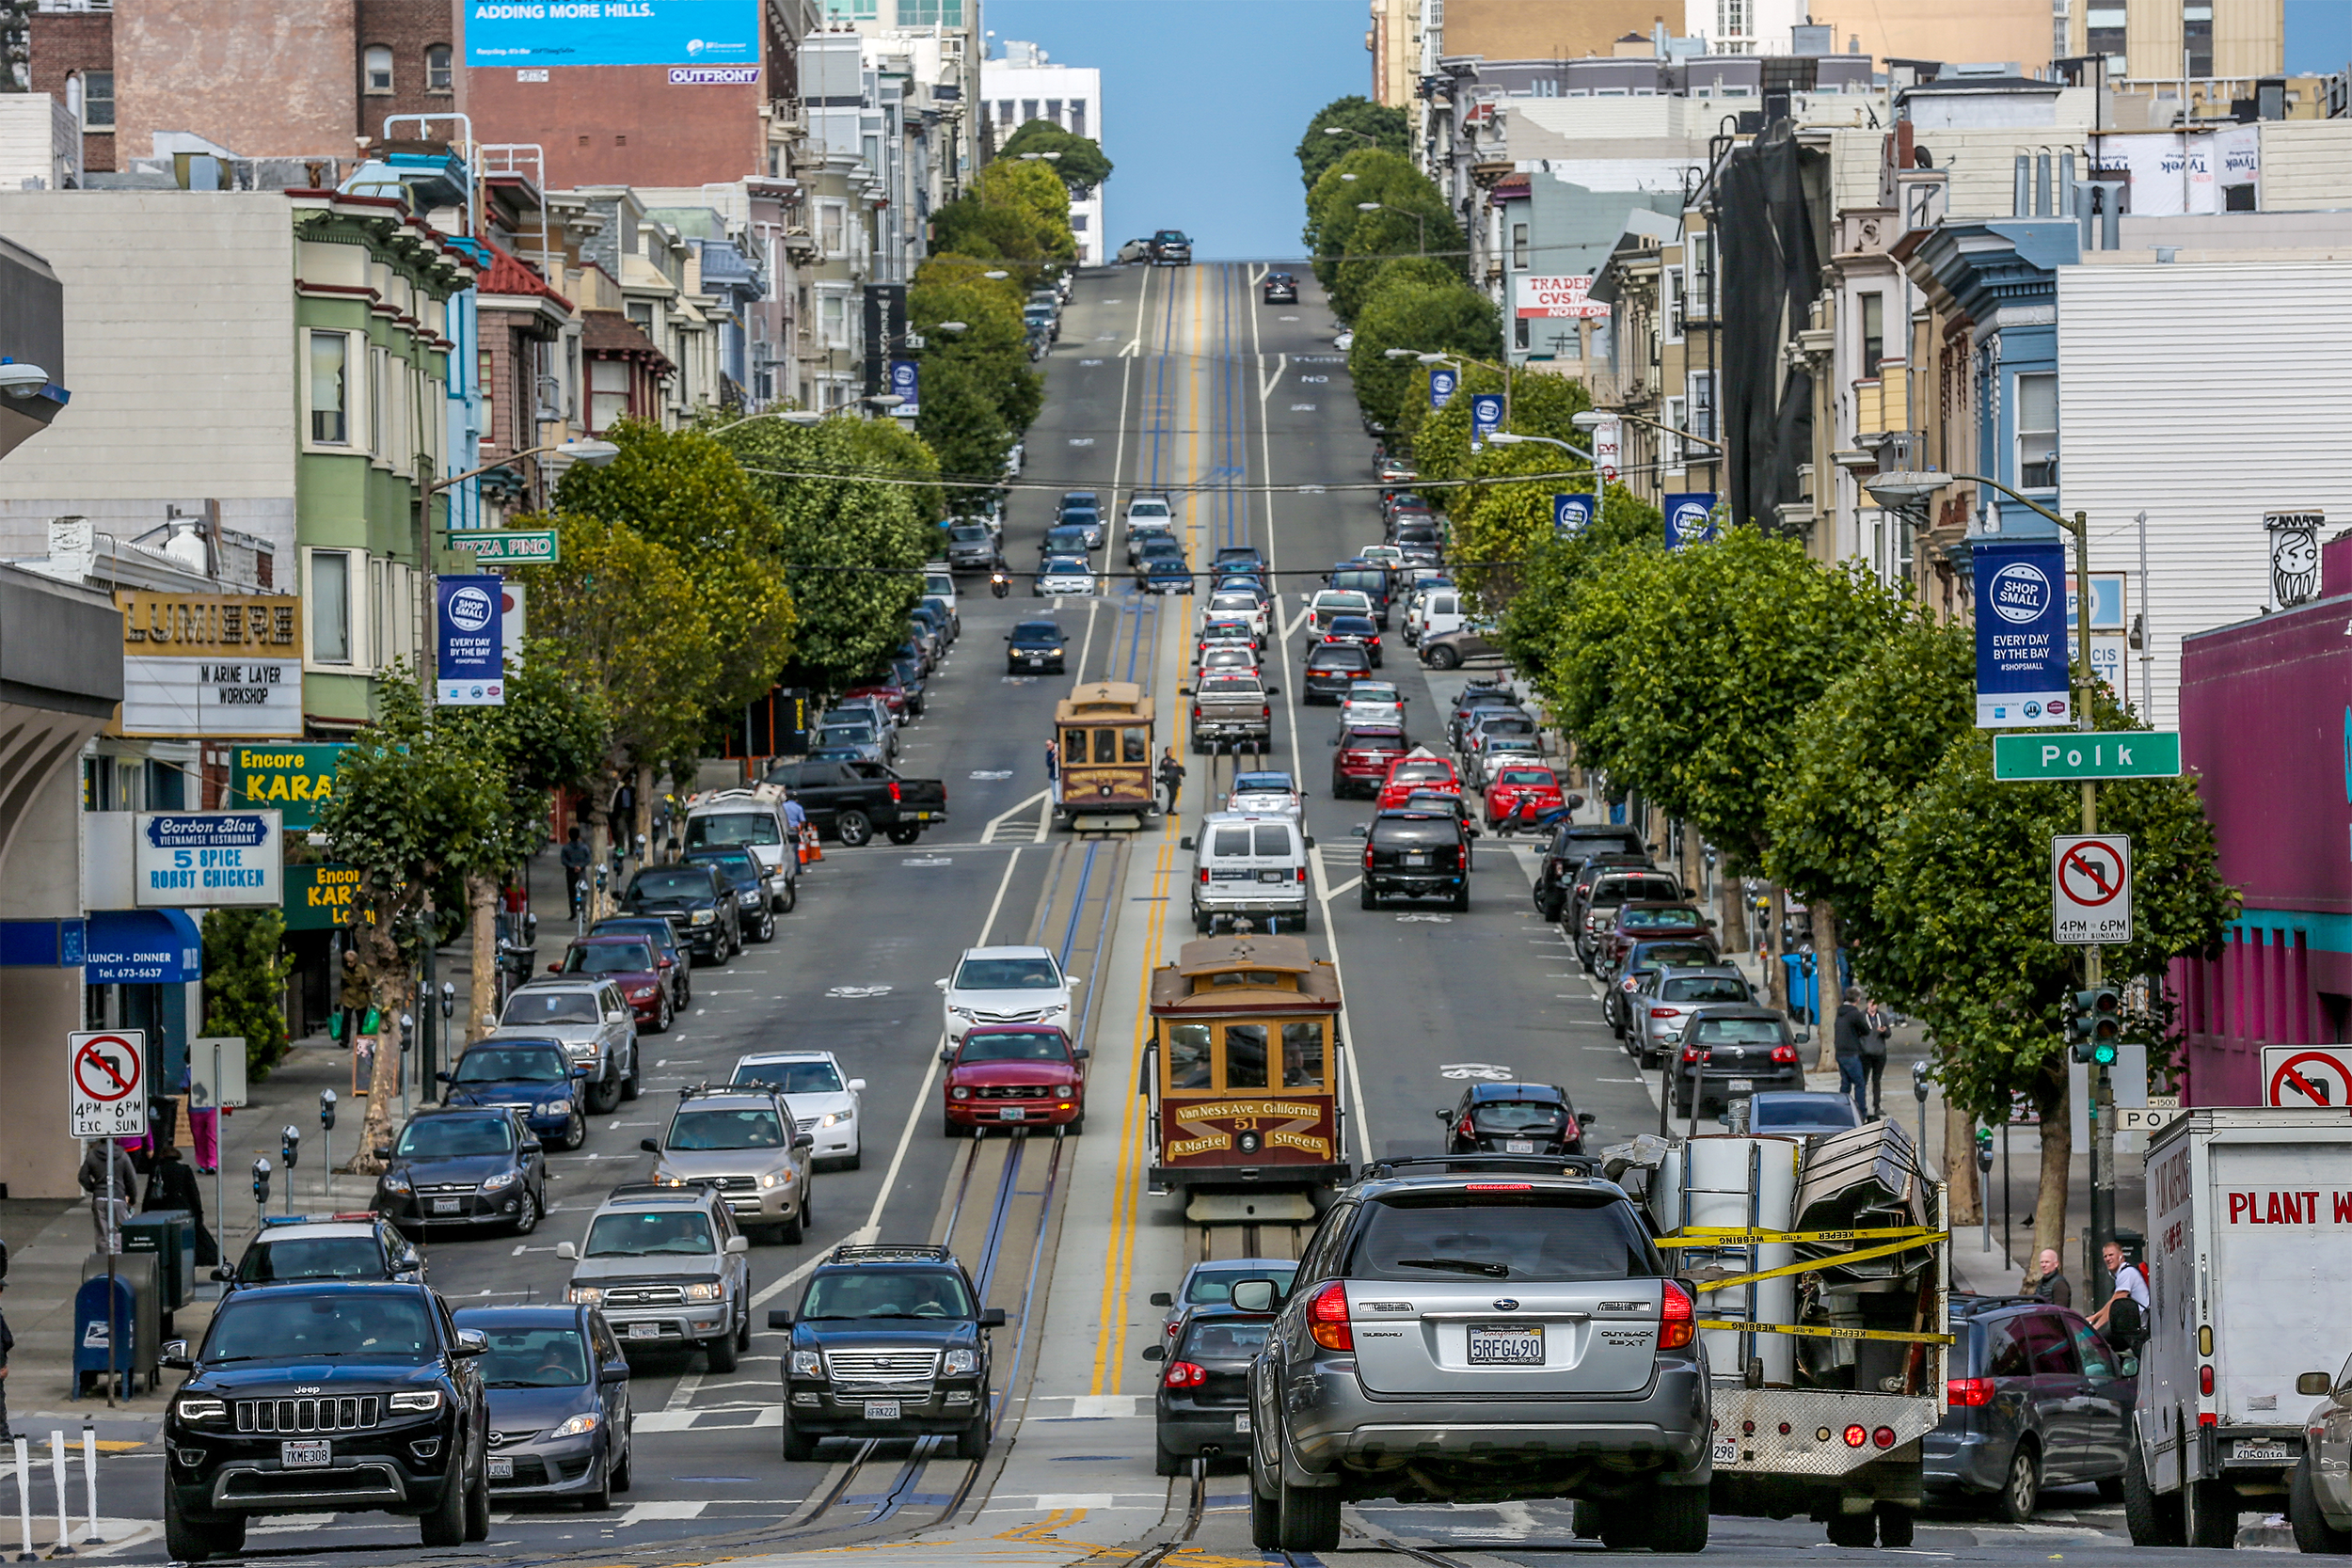
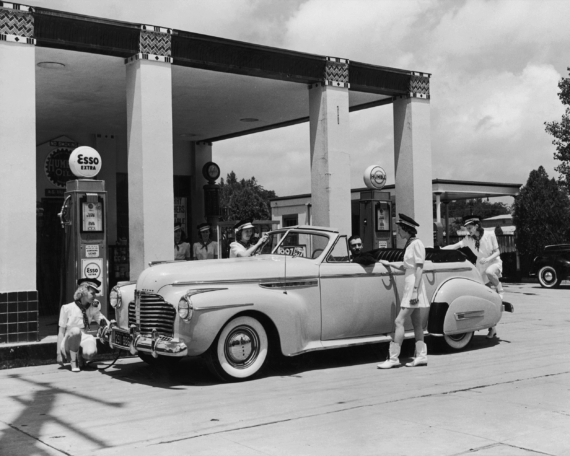
Cost of ownership and maintenance: 97th Traffic infrastructure: 95th Safety: 62nd Access to vehicles and maintenance: 66th San Francisco had the highest average gas prices at the time of writing: $3.35 per gallon. (San Antonio, Texas, had the lowest, at $1.75 per gallon, which is almost 50% less than San Francisco.)
Related: 12 Ways to Fill Up for Less at the Gas Station
Sign up for our newsletter
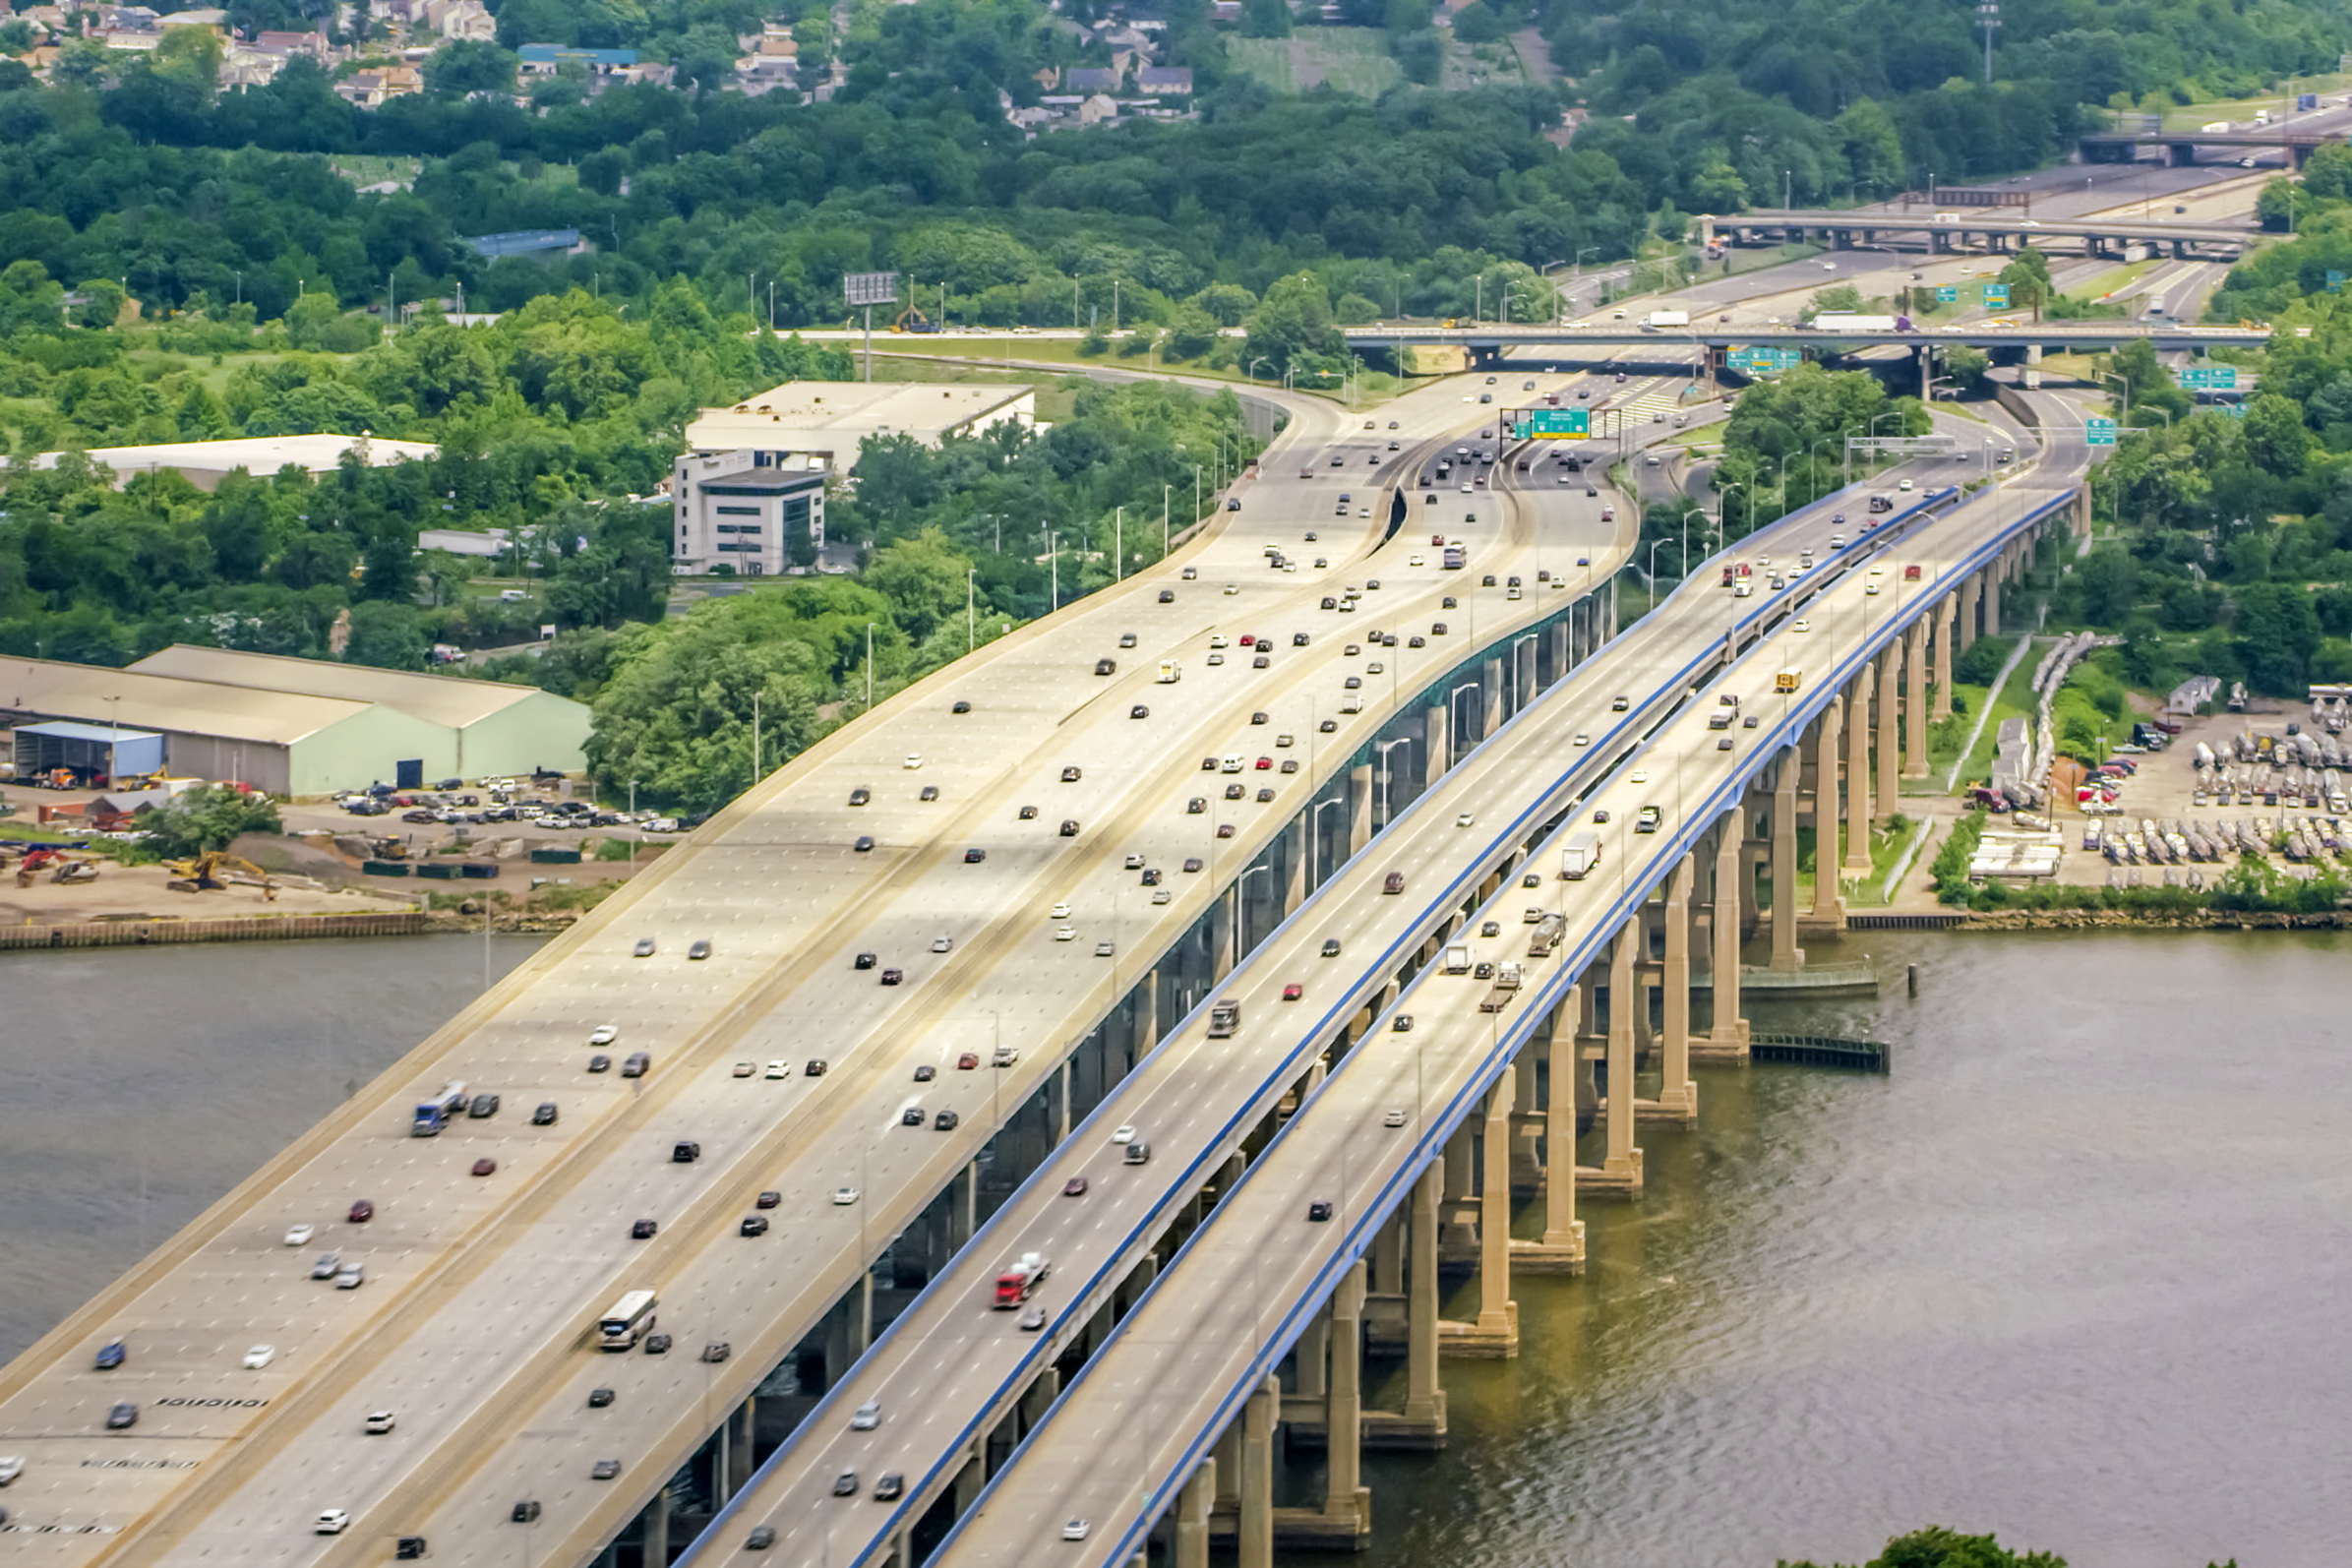
2nd Worst: Philadelphia
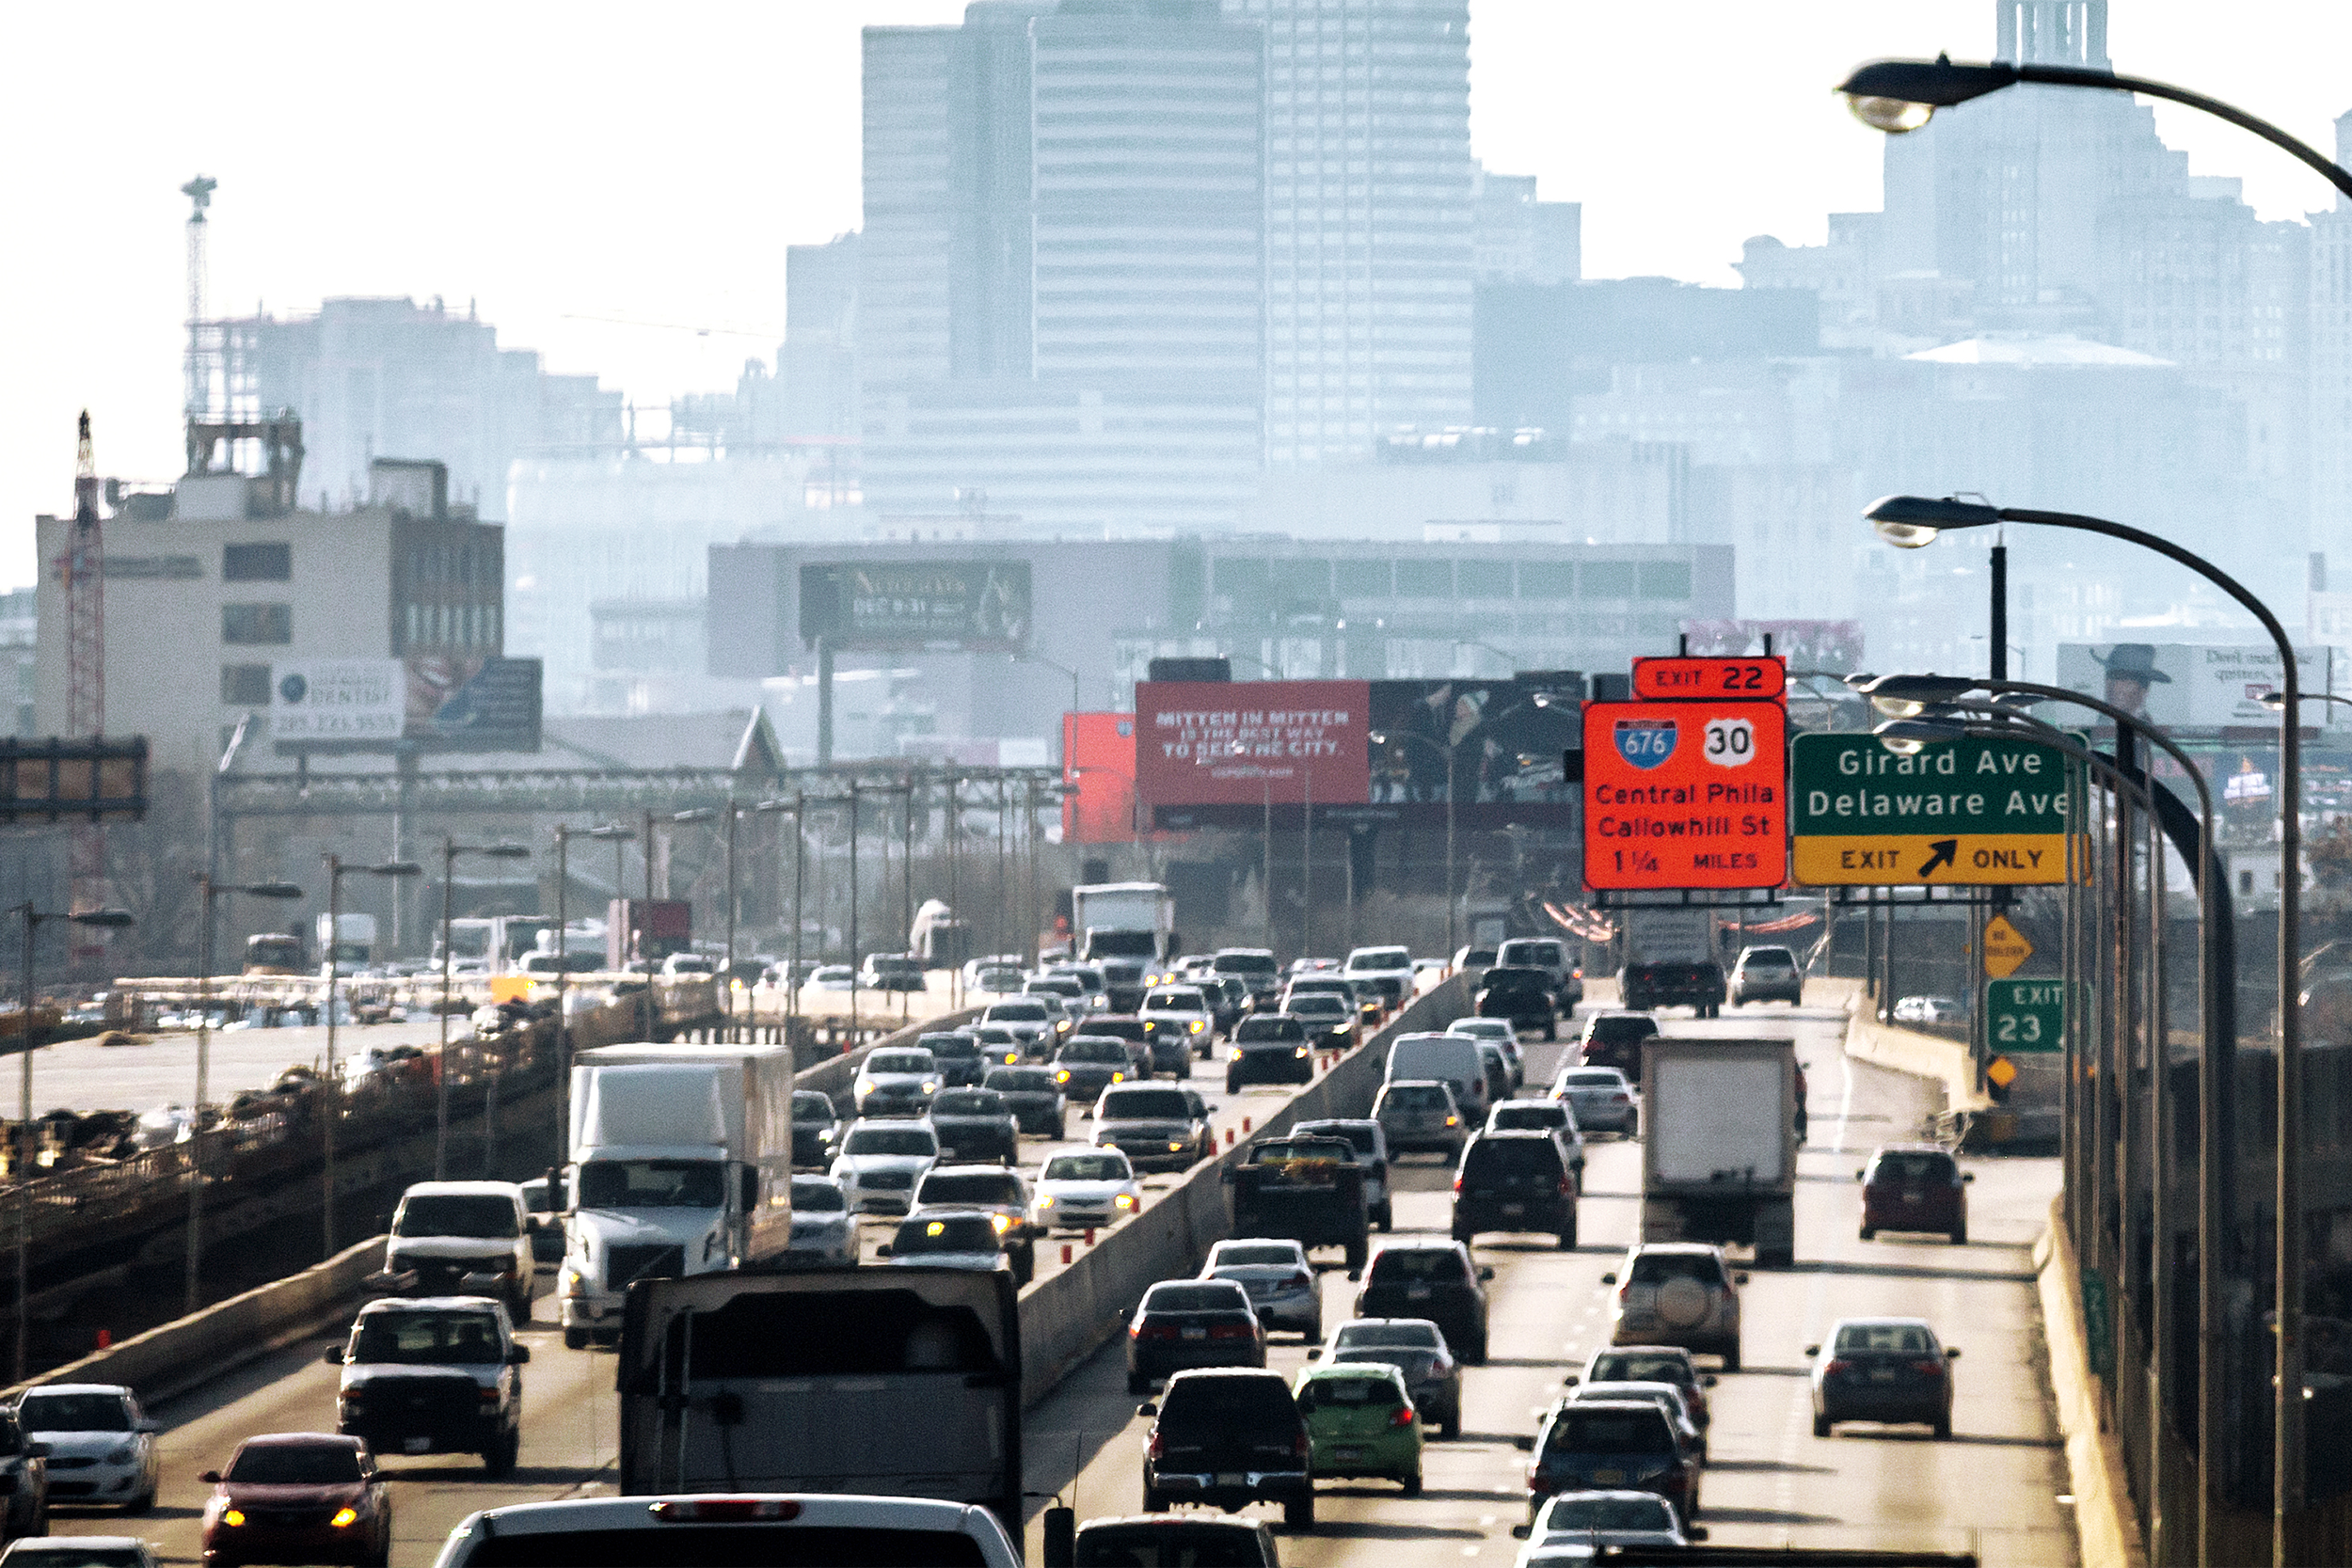
Cost of ownership and maintenance: 85th Traffic infrastructure: 97th Safety: 82nd Access to vehicles and maintenance: 77th Driving in Philadelphia looks miserable, especially given the city’s top-five rankings for highest parking rates and most traffic congestion.
Worst: Oakland, California
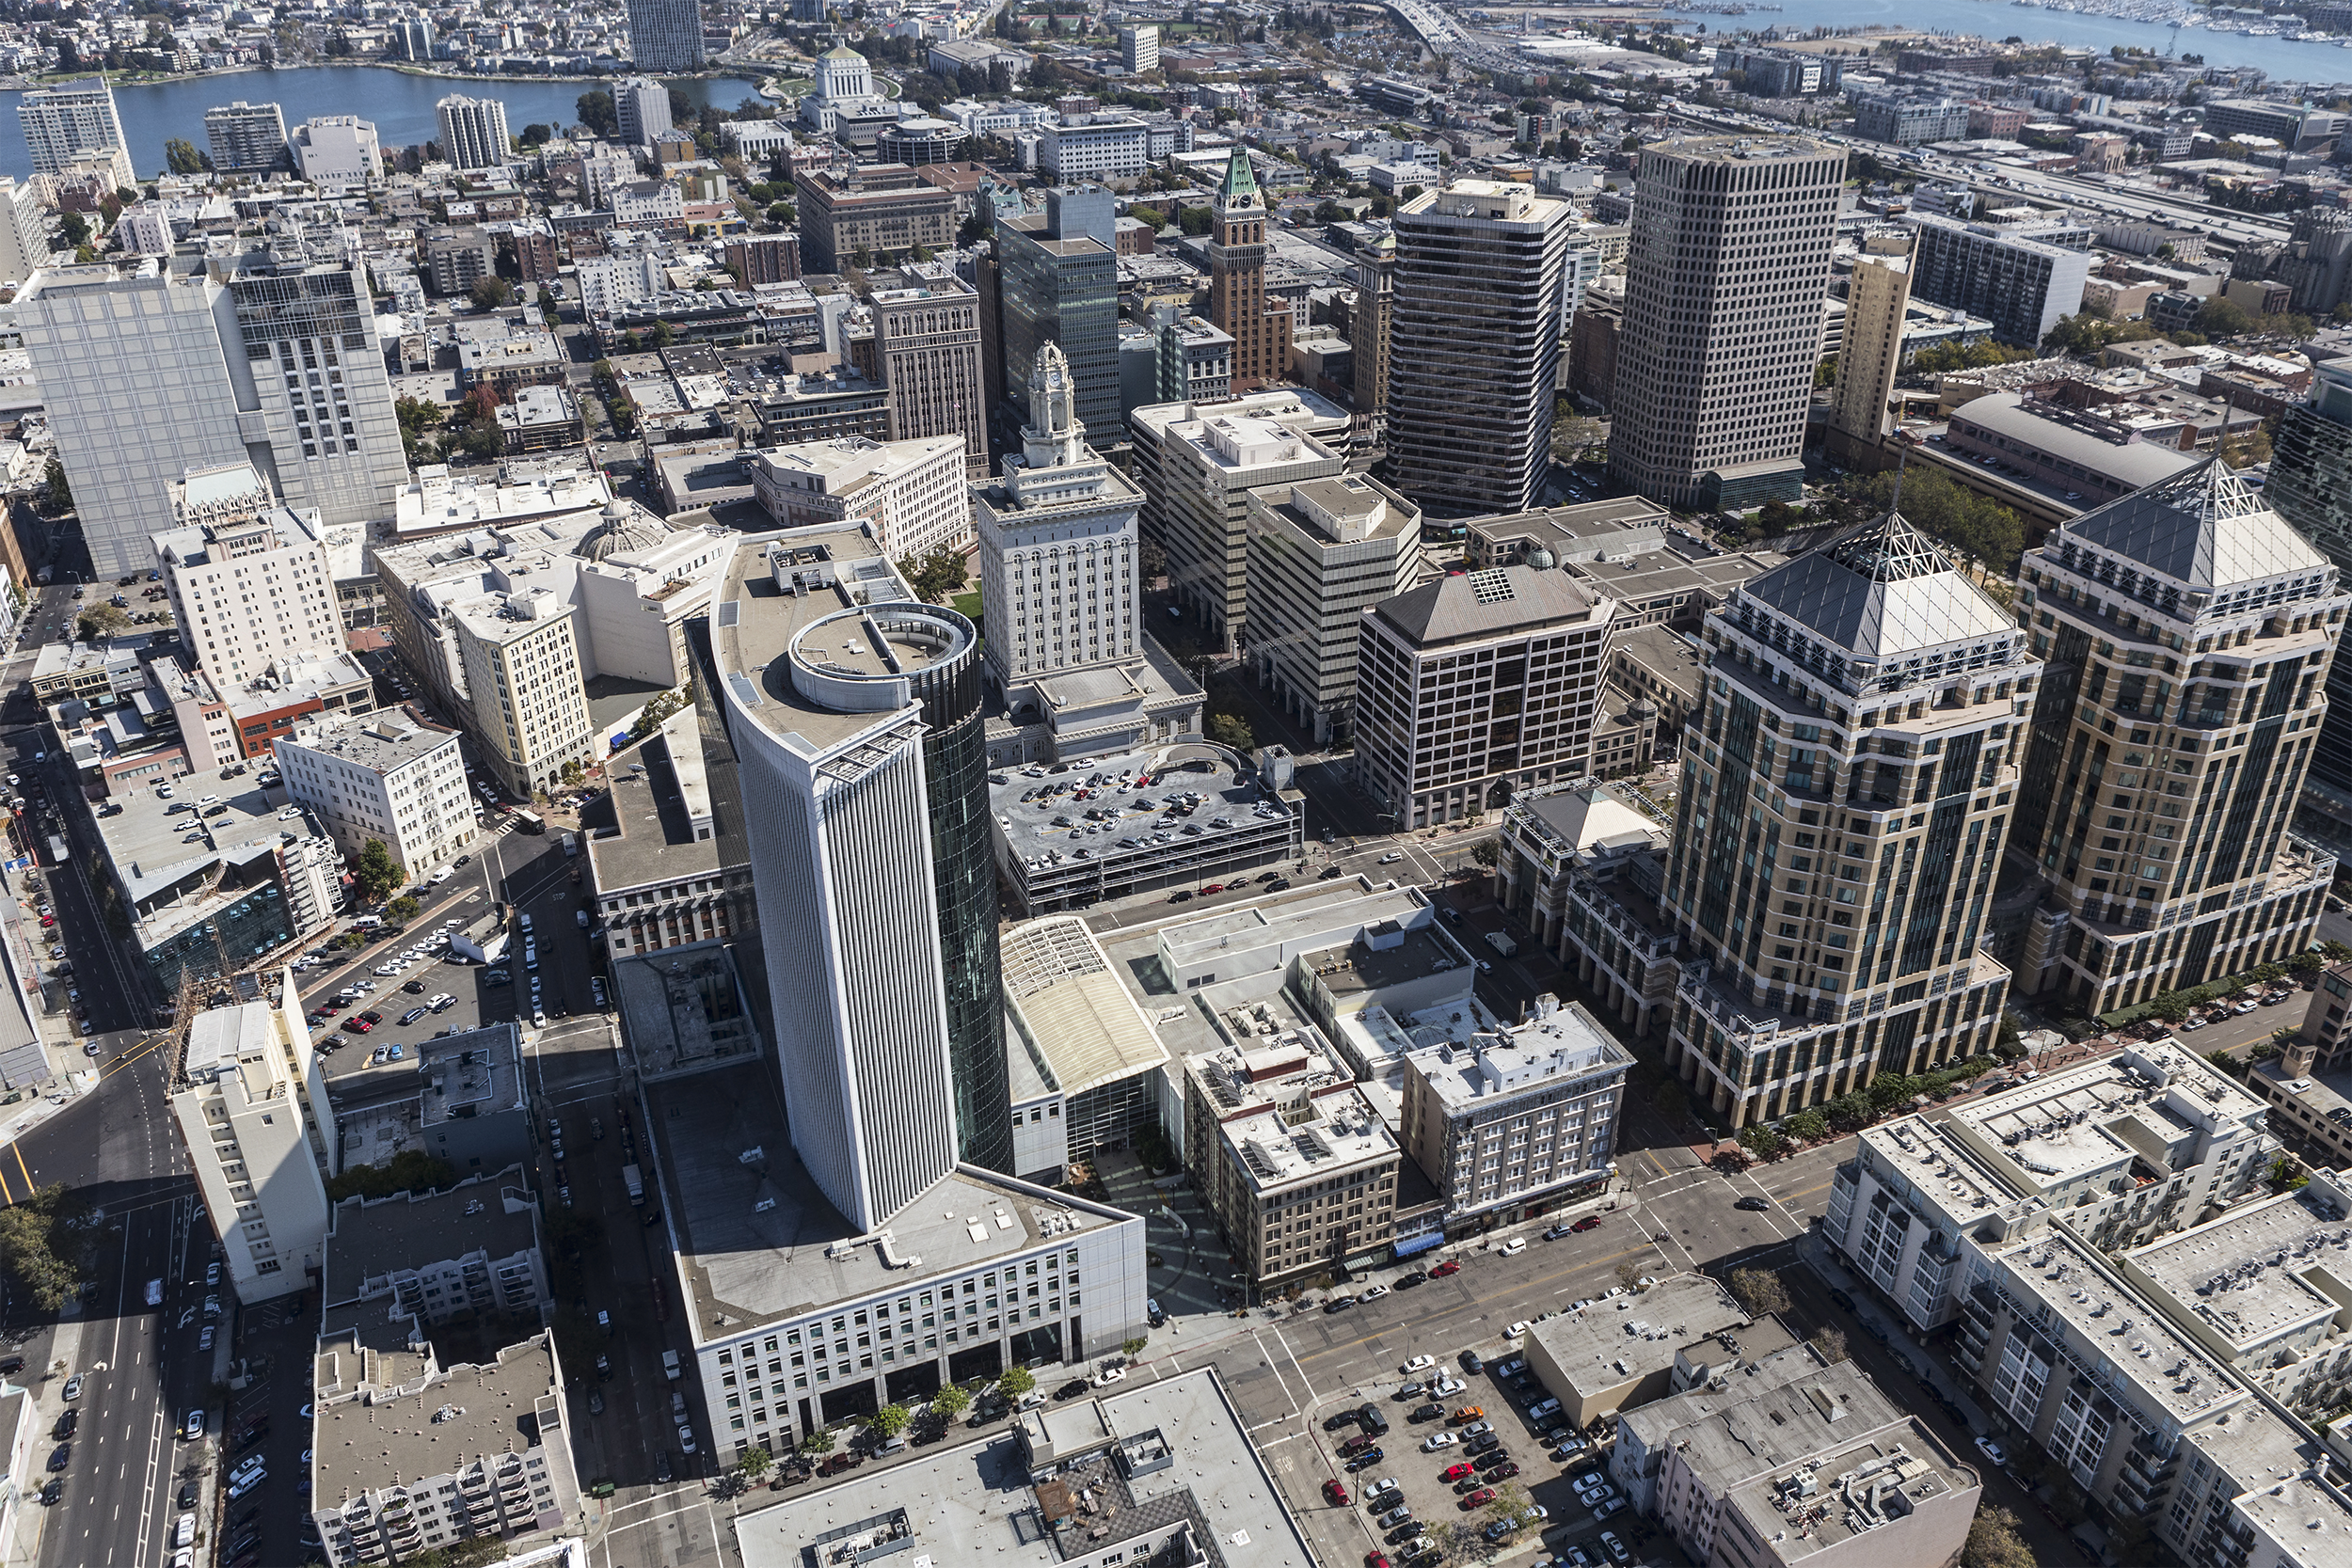
Cost of ownership and maintenance: 98th Traffic infrastructure: 92nd Safety: 85th Access to vehicles and maintenance: 44th These statistics make you want to sell your car and live car-free, relying on the Bay Area Rapid Transit system, bus lines, and commuter rail. Oakland is in WalletHub’s top five for likelihood of accidents and also for gas prices. In fact, the entire top of the list of highest gas prices is composed of California cities: San Francisco, Fremont, San Jose, Chula Vista, and San Diego.
Related: 18 Cities Where You Can Live Car-Free
10th Best: Omaha, Nebraska
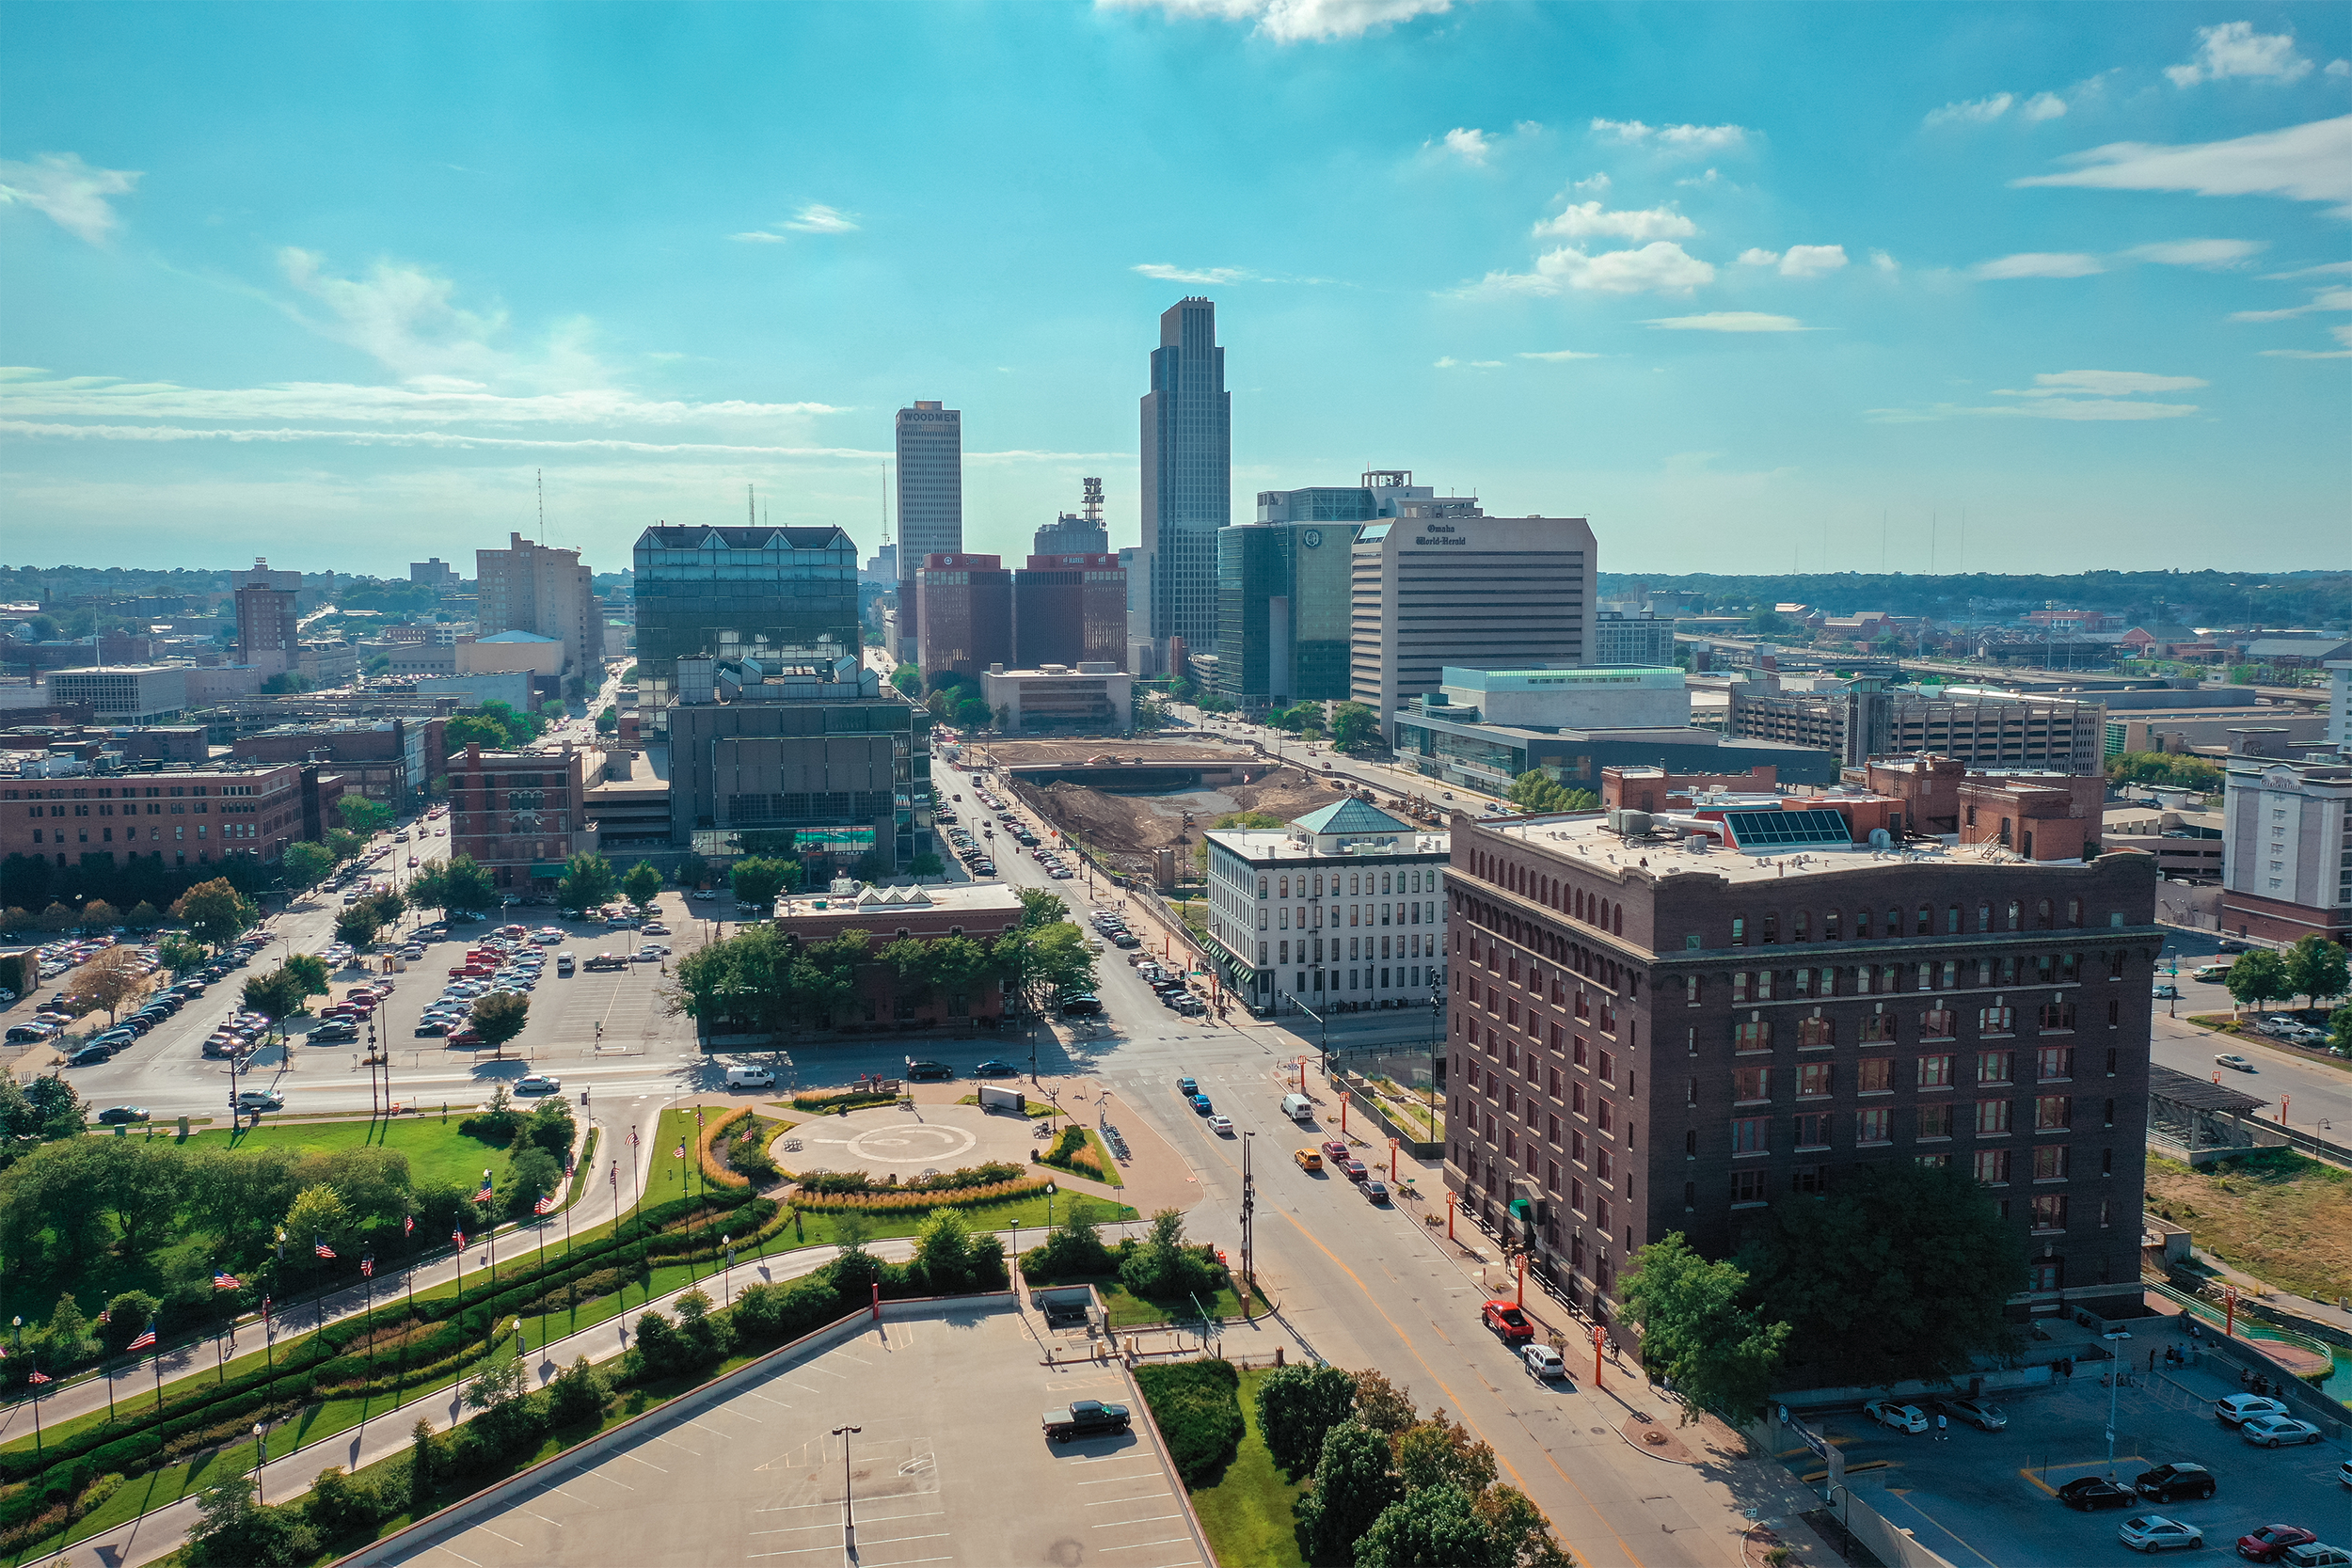
Cost of ownership and maintenance: 15th Traffic infrastructure: 26th Safety: 45th Access to vehicles and maintenance: 48th True, Nebraska’s traffic deaths in 2019 were the highest in 12 years, according to the Nebraska Department of Transportation. And the site Car Insurance 101 found it has the fourth-most-dangerous teen drivers in the country (a list topped by Montana, Arkansas, and Louisiana). But the state saw almost 3,300 fewer crashes last year even though it also added 350,000 licensed drivers in 30 years, for more miles traveled, the Lincoln Journal Star reported.
9th Best: Orlando, Florida
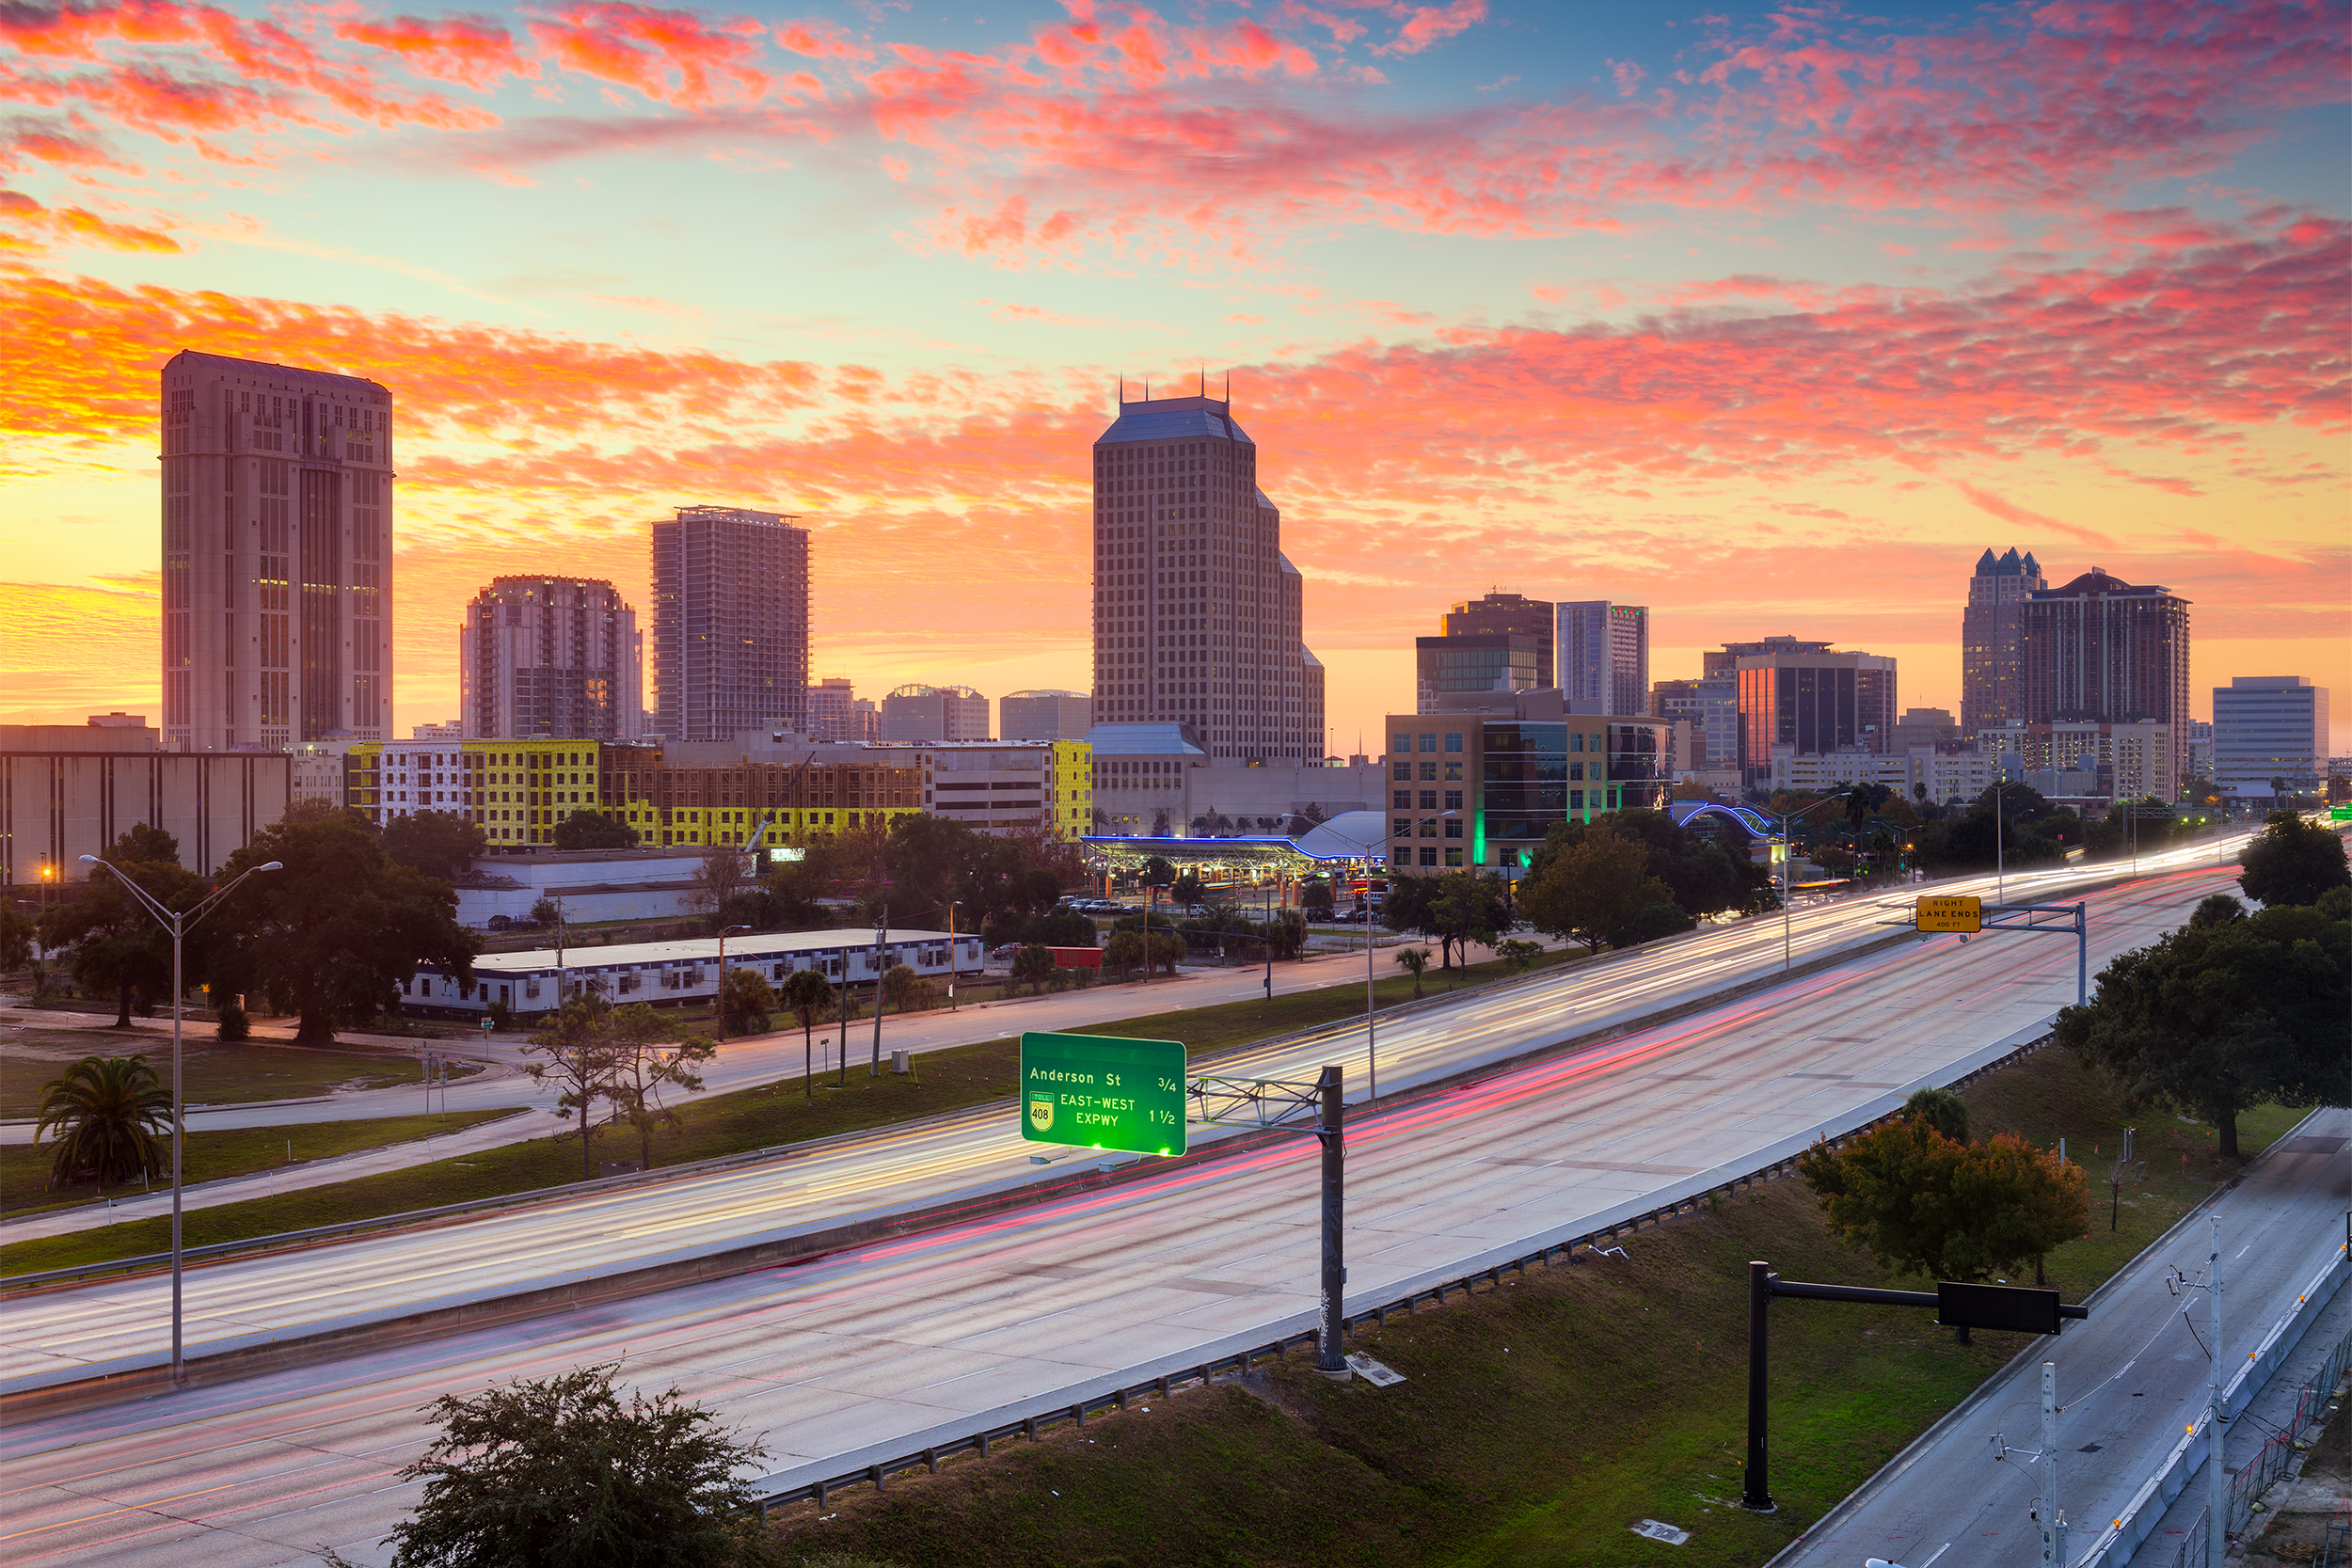
Cost of ownership and maintenance: 29th Traffic infrastructure: 1st Safety: 93rd Access to vehicles and maintenance: 2nd Drivers enjoy especially low auto maintenance costs in Orlando, and they’re also especially concerned about their car finishes, considering all the sun, pollen, and ocean salt: Orlando is in the top five for most car washes per capita, along with Tampa and Miami. (Rounding out the top five are Las Vegas and San Diego.)
Related: 18 Car Expenses That Are Really Worth the Money
8th Best: Nashville, Tennessee
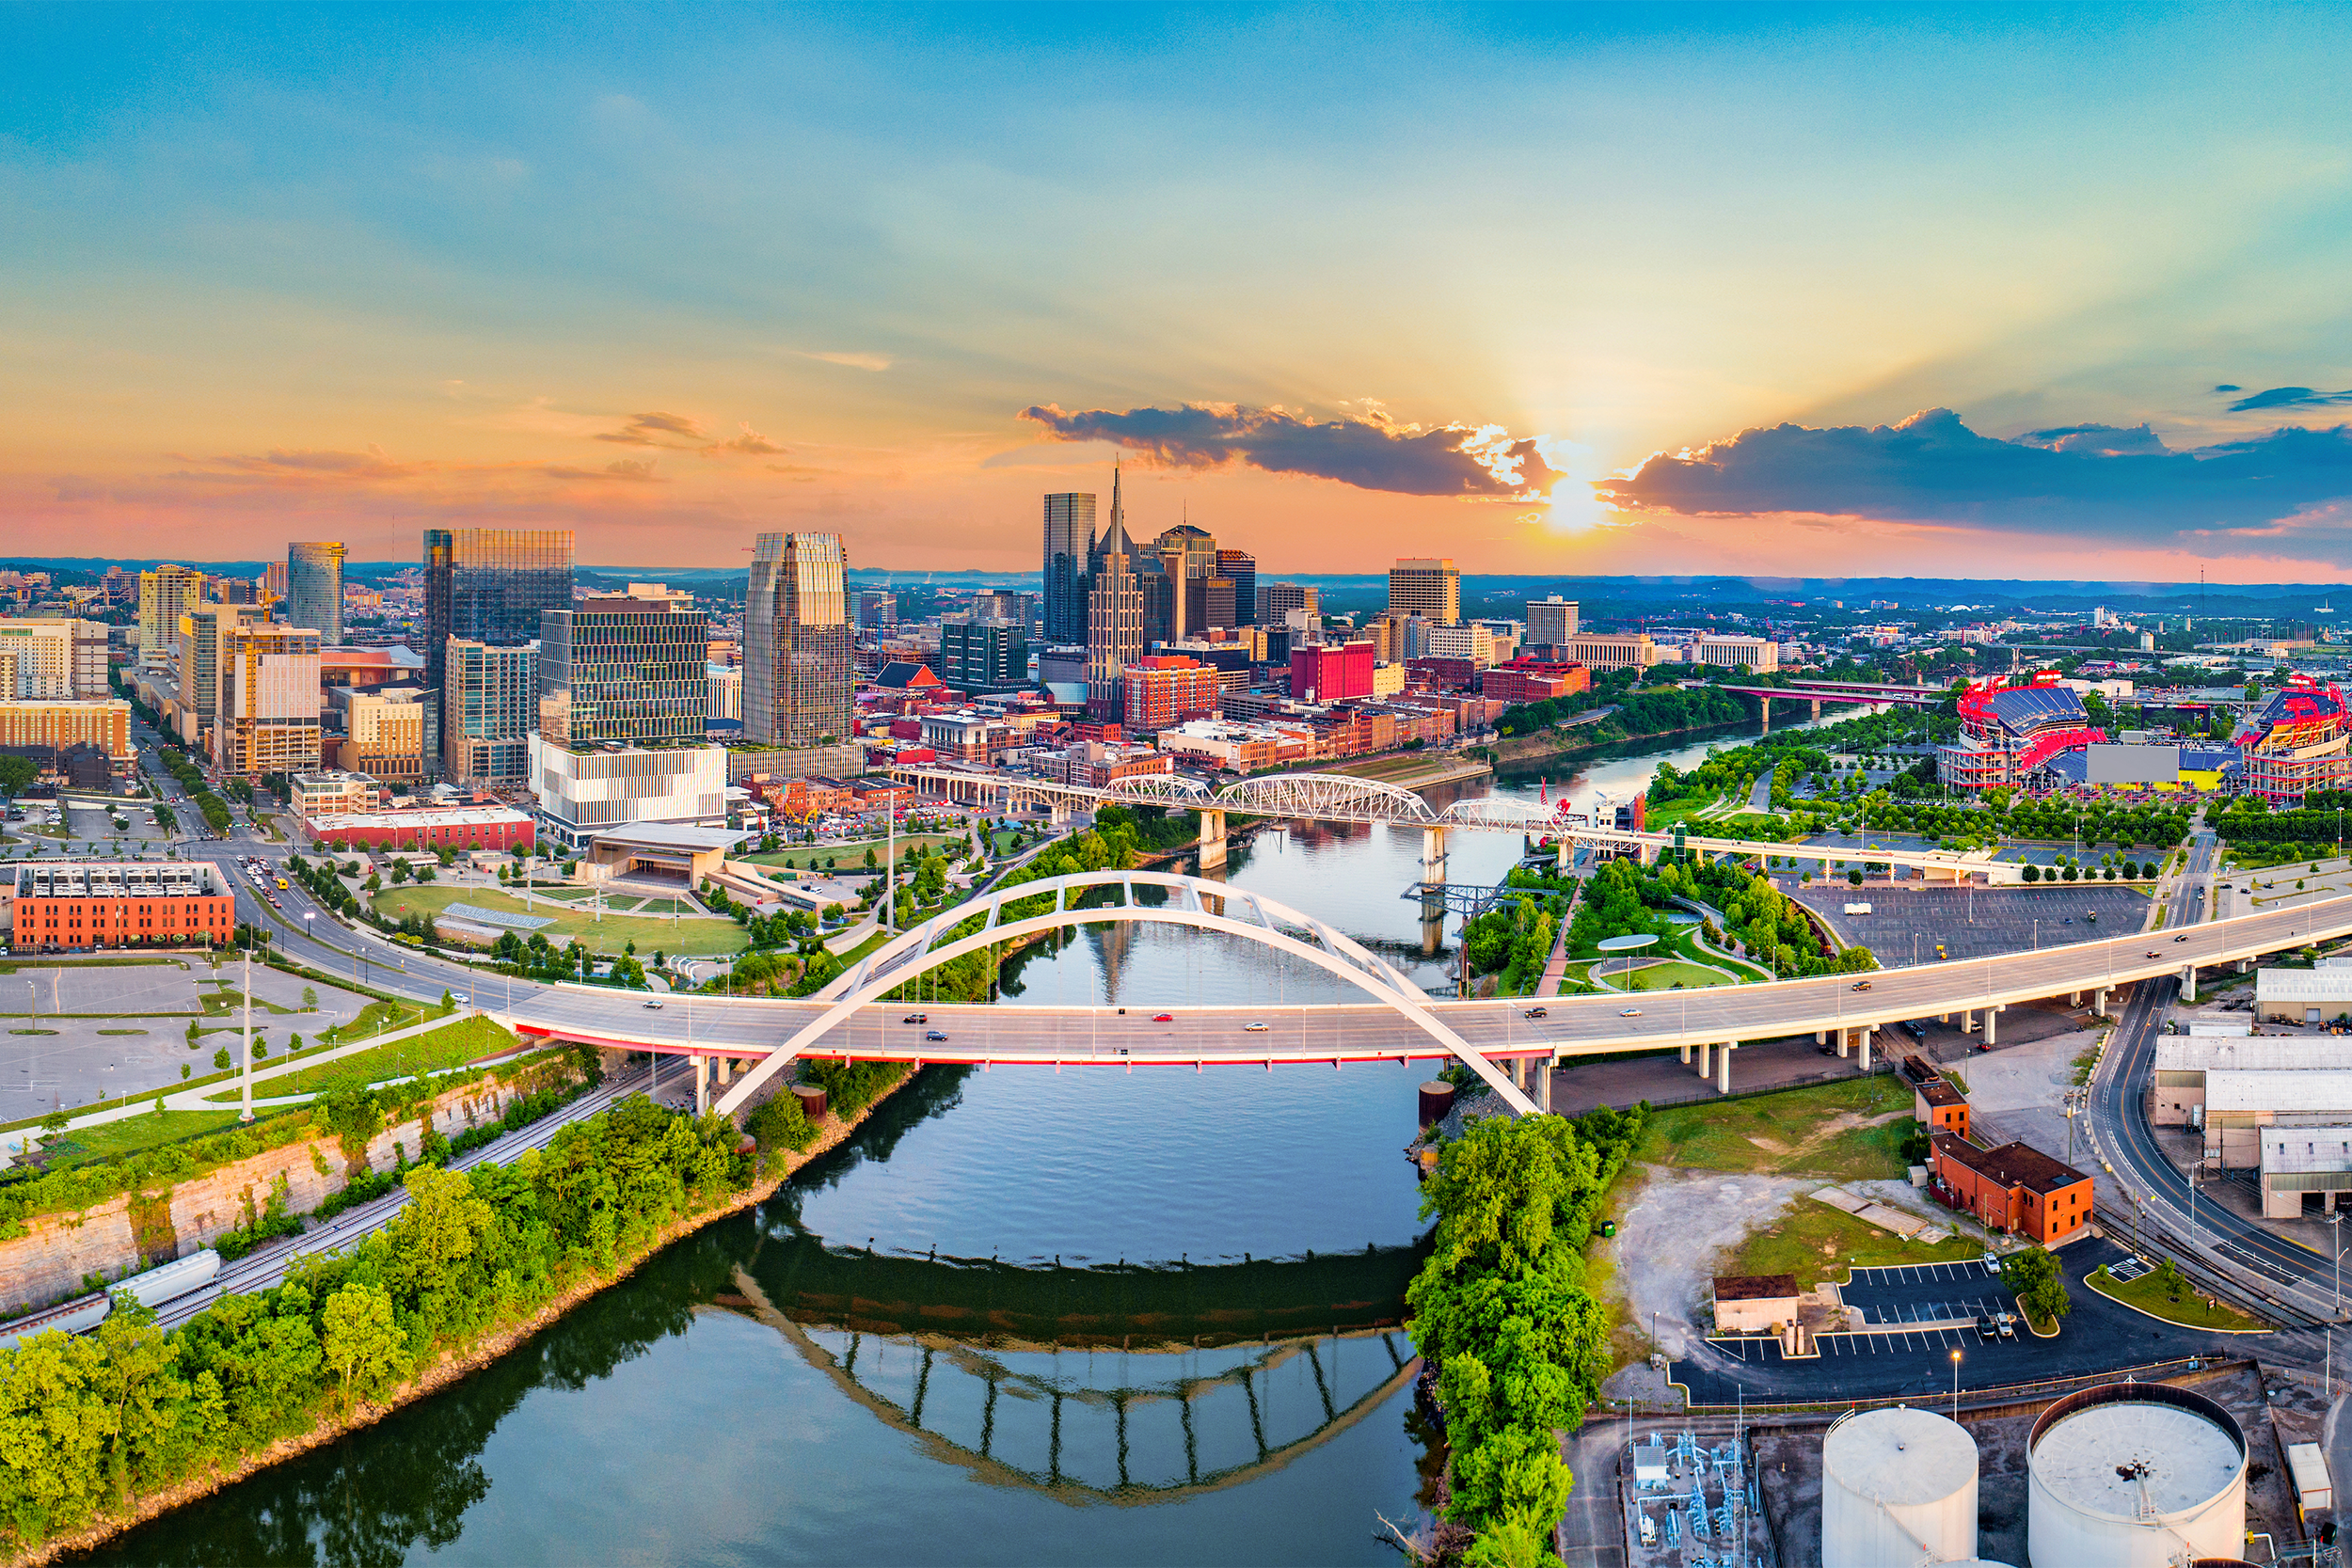
Cost of ownership and maintenance: 5th Traffic infrastructure: 16th Safety: 76th Access to vehicles and maintenance: 41st Well, 2020 is looking better for Nashville drivers than 2019, when a year-over-year 8.2% increase in traffic deaths meant more than 1,100 people died on Tennessee roads — and Nashville’s Davidson County saw a 27% jump, for 102 traffic deaths, according to Metro Nashville’s Police Department. Of those, 26 were pedestrians.
Related: 20 Most Dangerous Places in America for Pedestrians
7th Best: Winston-Salem, North Carolina
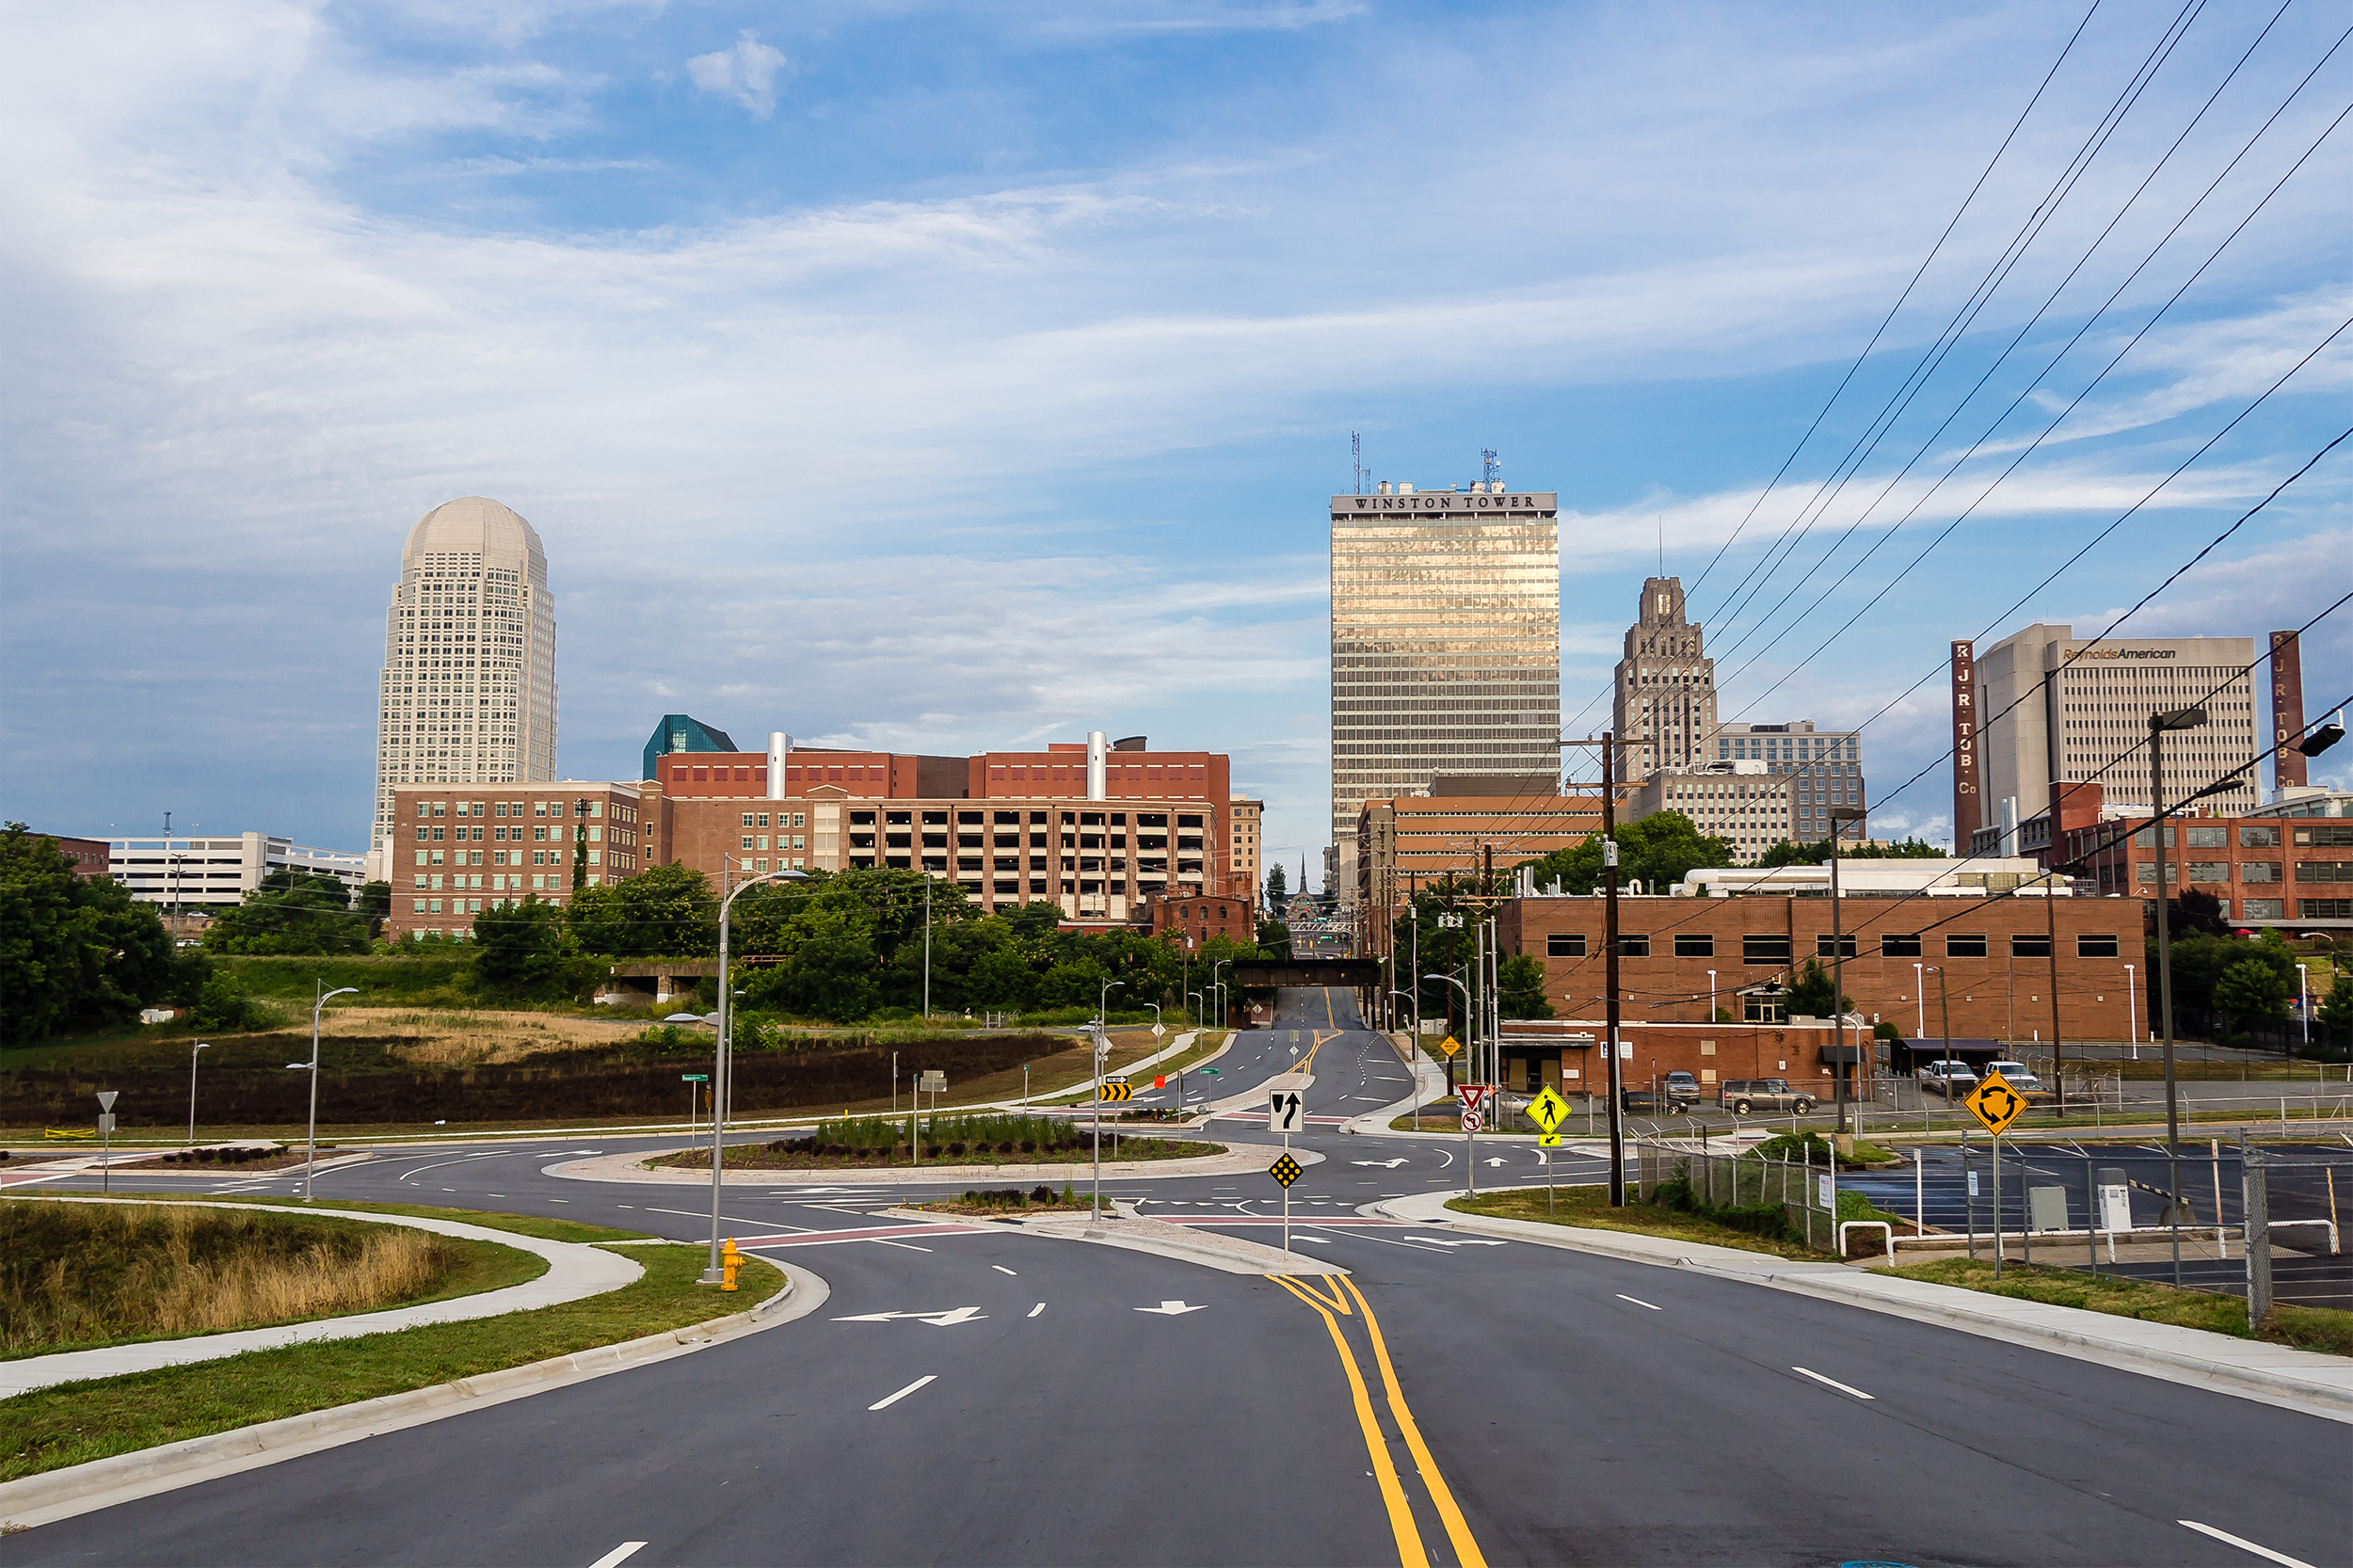
Cost of ownership and maintenance: 1st Traffic infrastructure: 30th Safety: 36th Access to vehicles and maintenance: 91st This ranking is good news for Winston-Salem, considering that last year it topped a list of “drunkest-driving cities in America,” beating out Boston; Columbus, Ohio; Columbia, South Carolina; and Boise, Idaho.
Related: Don’t Believe These 19 Myths About Alcohol
6th Best: Plano, Texas
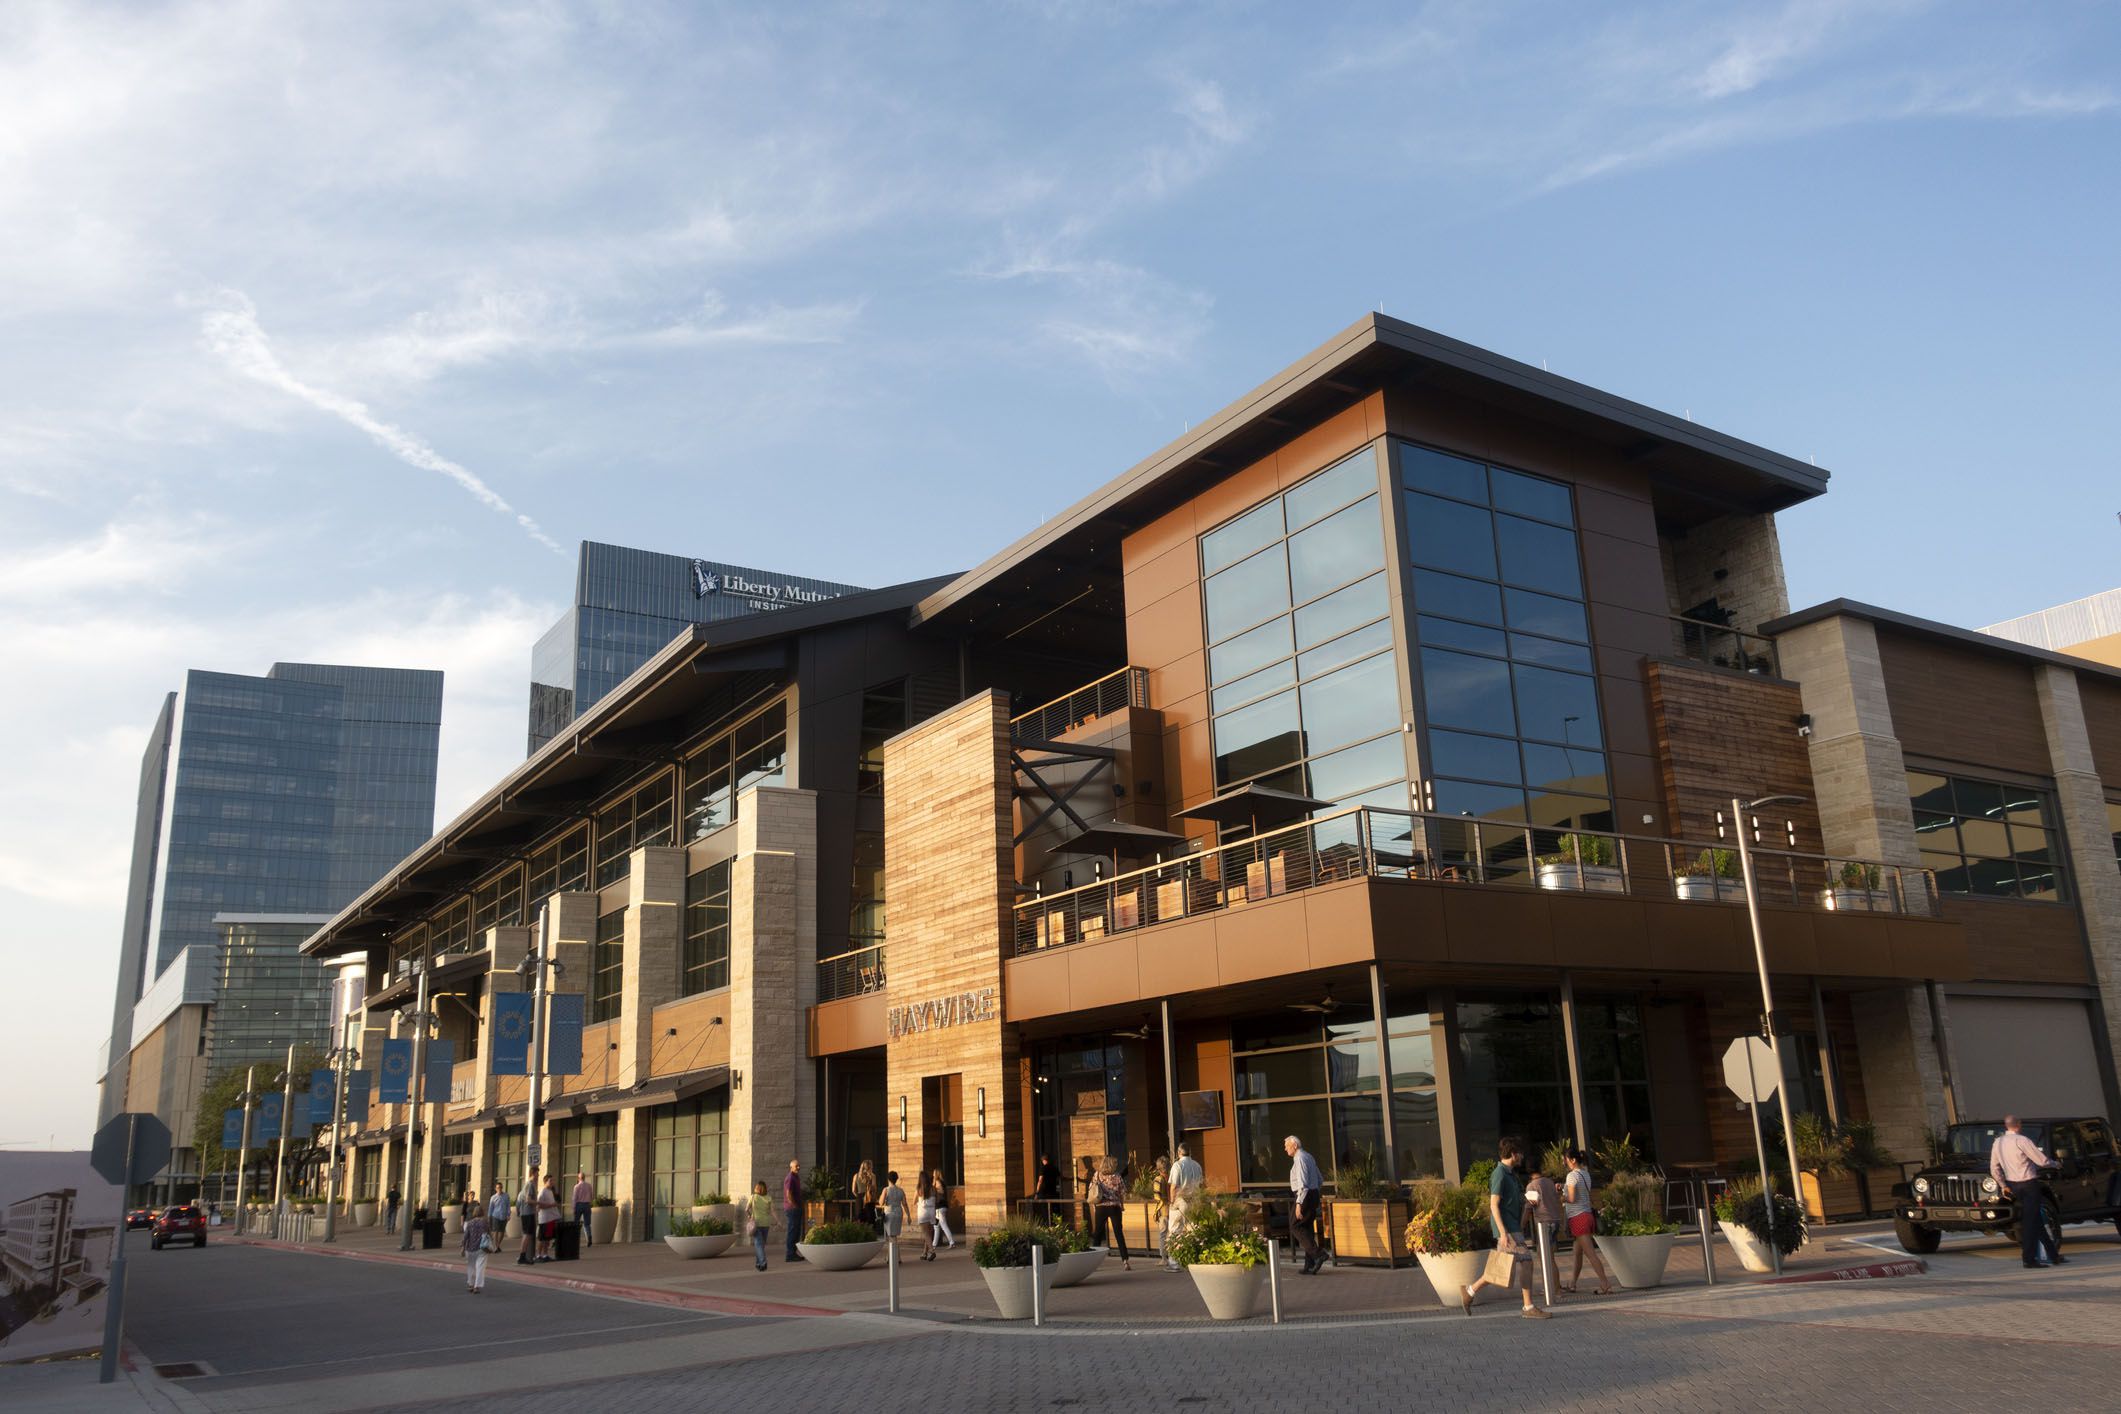
Cost of ownership and maintenance: 16th Traffic infrastructure: 49th Safety: 9th Access to vehicles and maintenance: 37th Plano is big — 72 square miles with an estimated 287,677 people — and its high overall ranking for drivers from WalletHub doesn’t mean it’s totally safe: Averaging traffic statistics from 2013 to last year, lawyer Michael Grossman found that the city sees around 5,669 crashes annually, with 2,333 injuries and 11 deaths.
Related: The 20 Safest Big Cities in America
5th Best: Boise, Idaho
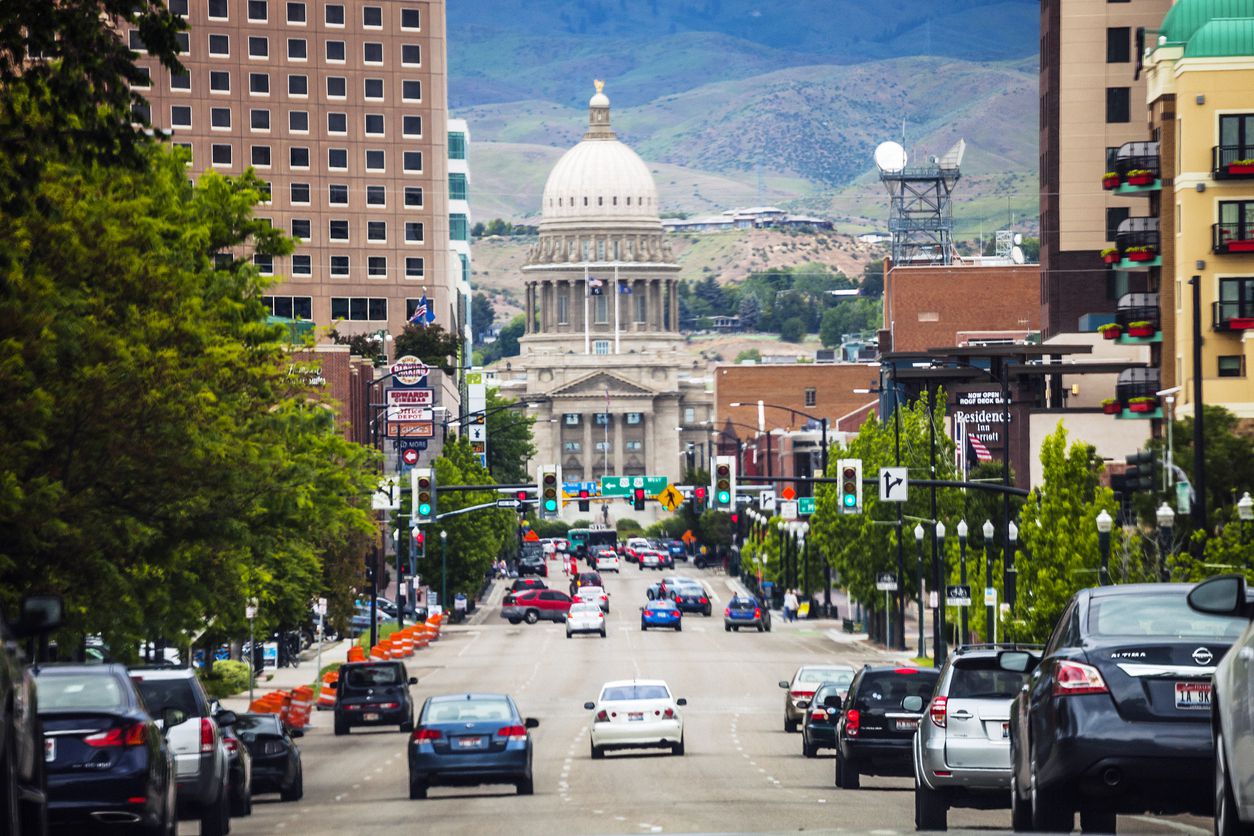
Cost of ownership and maintenance: 39th Traffic infrastructure: 4th Safety: 3rd Access to vehicles and maintenance: 85th You can feel pretty safe in Boise despite the city’s appearance on that list of “drunkest-driving cities in America.” It’s still managed to be in the top five cities in WalletHub’s ranking for rate of accidents compared with the national average (along with Laredo, Texas; Madison, Wisconsin; Colorado Springs, Colorado; and Scottsdale, Arizona).
Related: 10 College Towns That Retirees Love, Too
4th Best: Greensboro, North Carolina
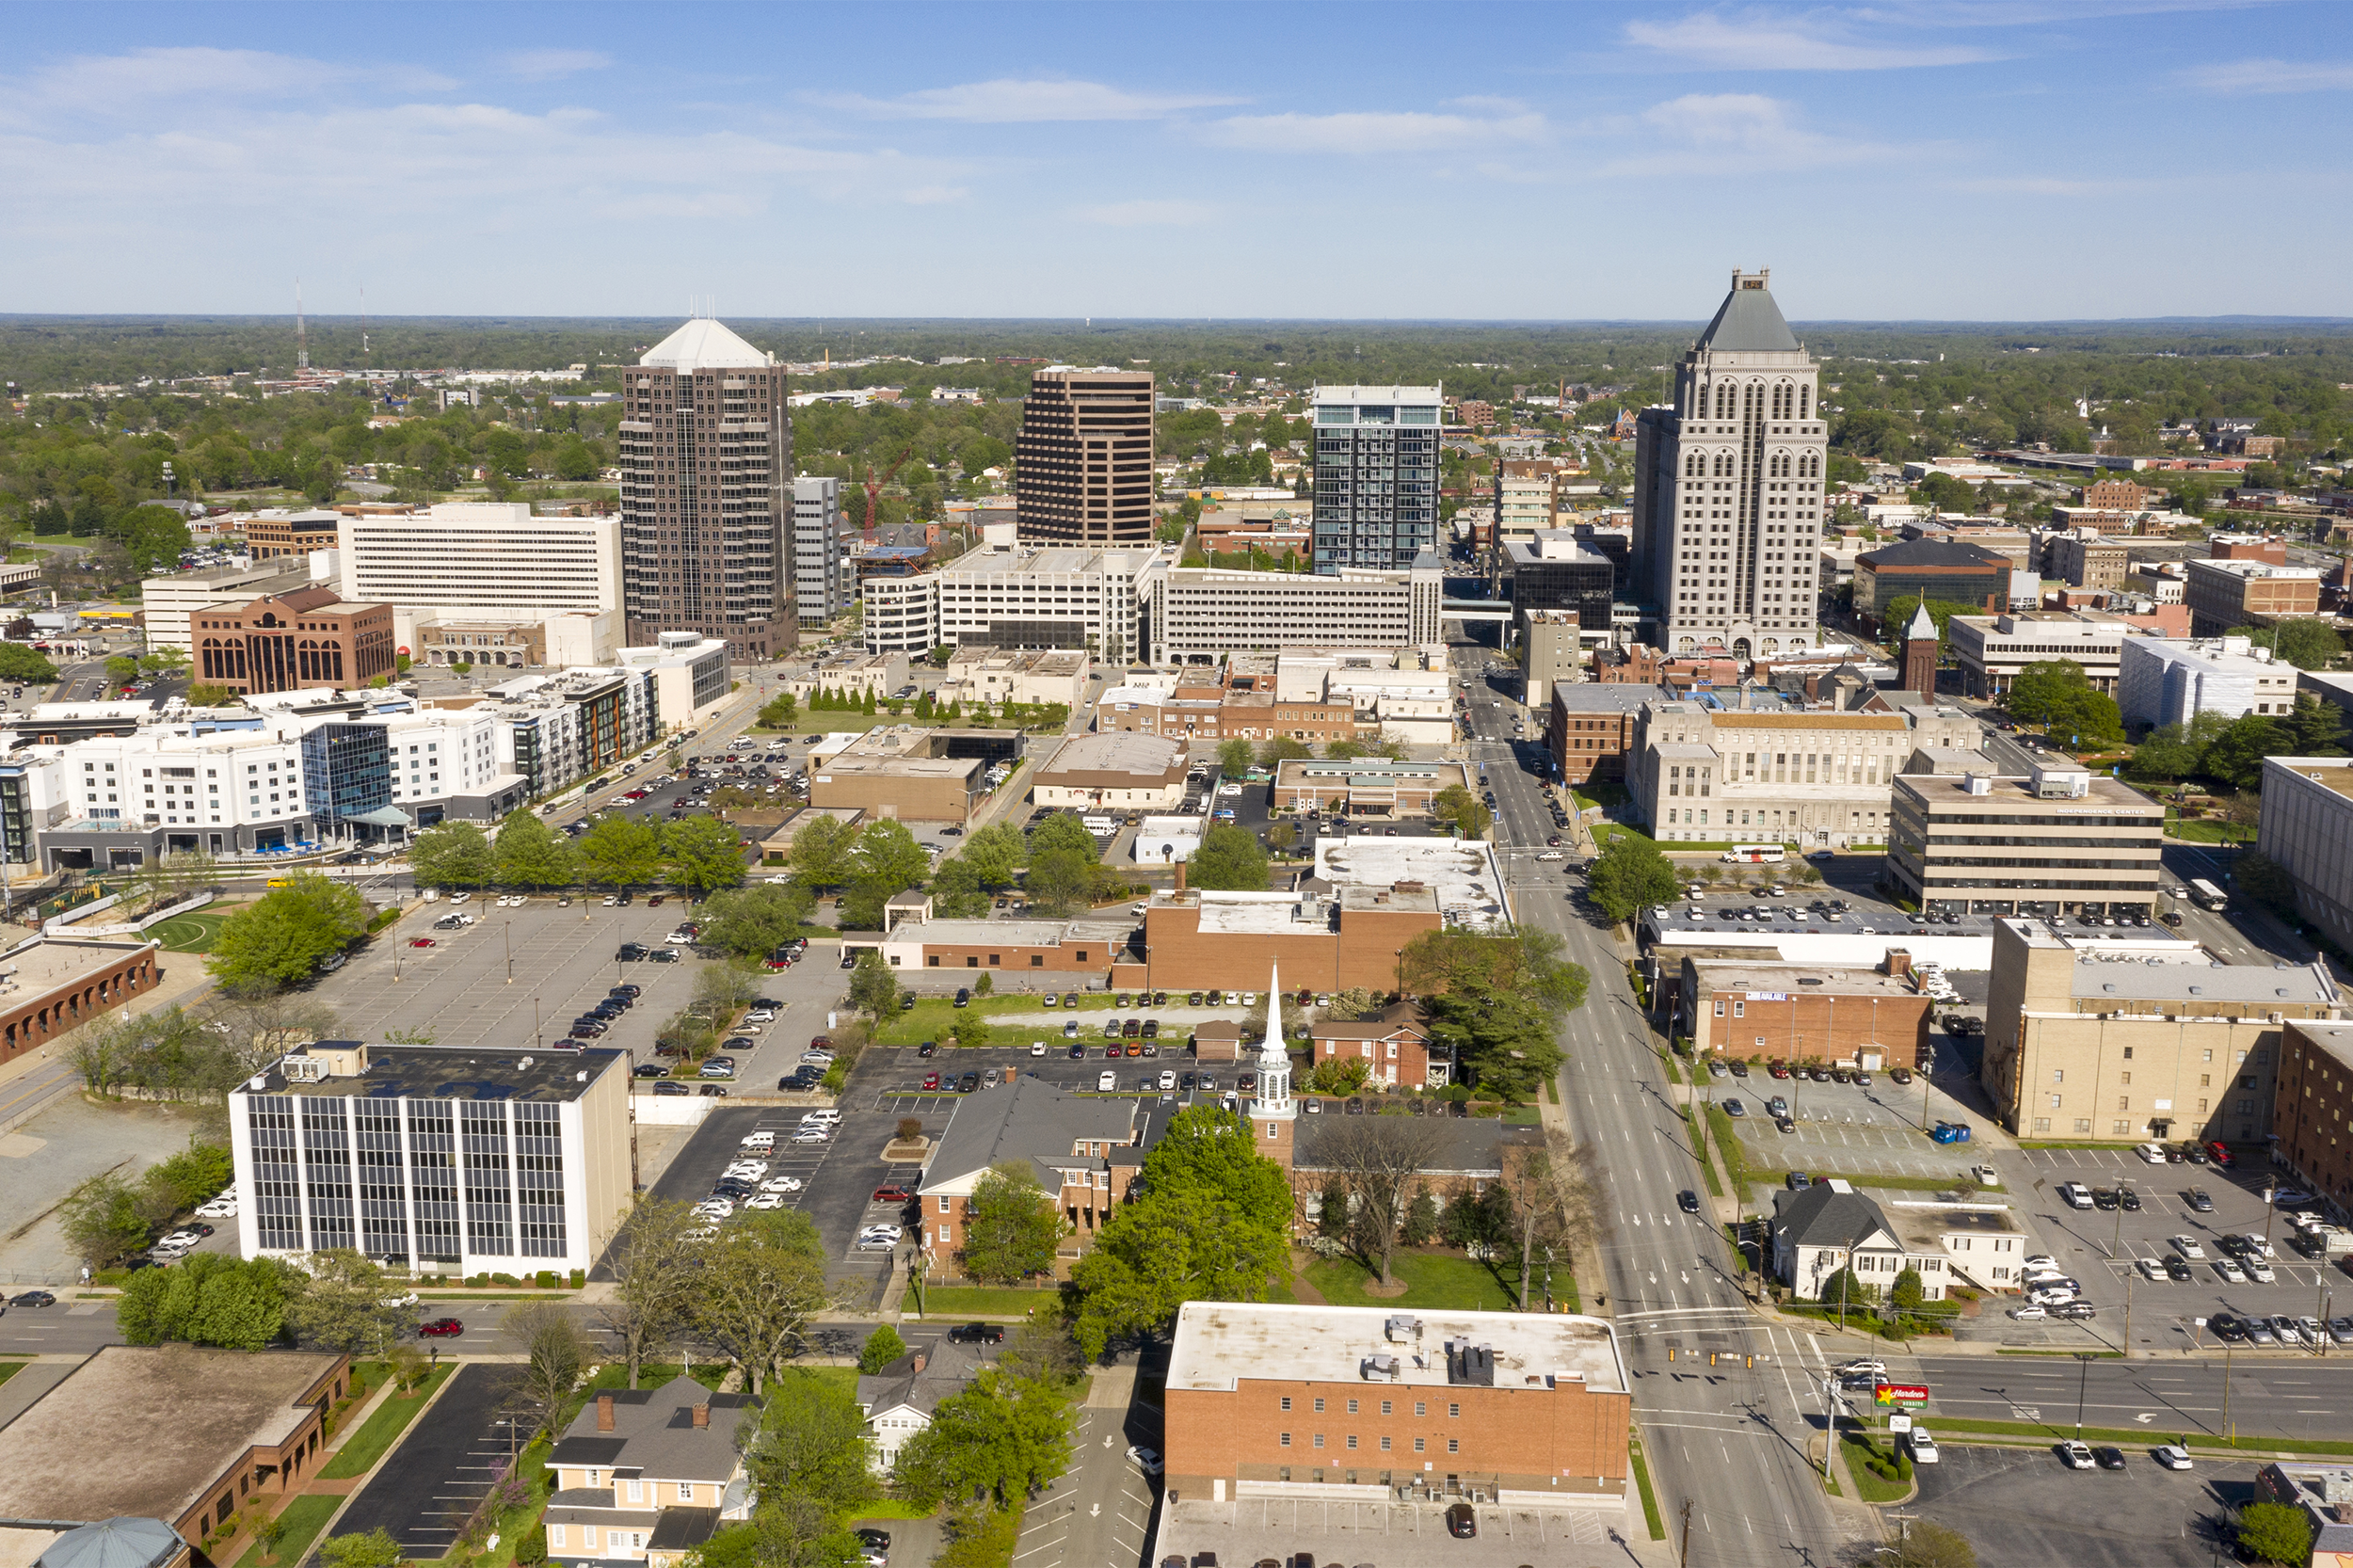
Cost of ownership and maintenance: 2nd Traffic infrastructure: 38th Safety: 30th Access to vehicles and maintenance: 39th Greensboro doesn’t just promise some of the fewest hours spent in traffic. It also has some of the lowest auto maintenance costs in the country.
3rd Best: Corpus Christi, Texas
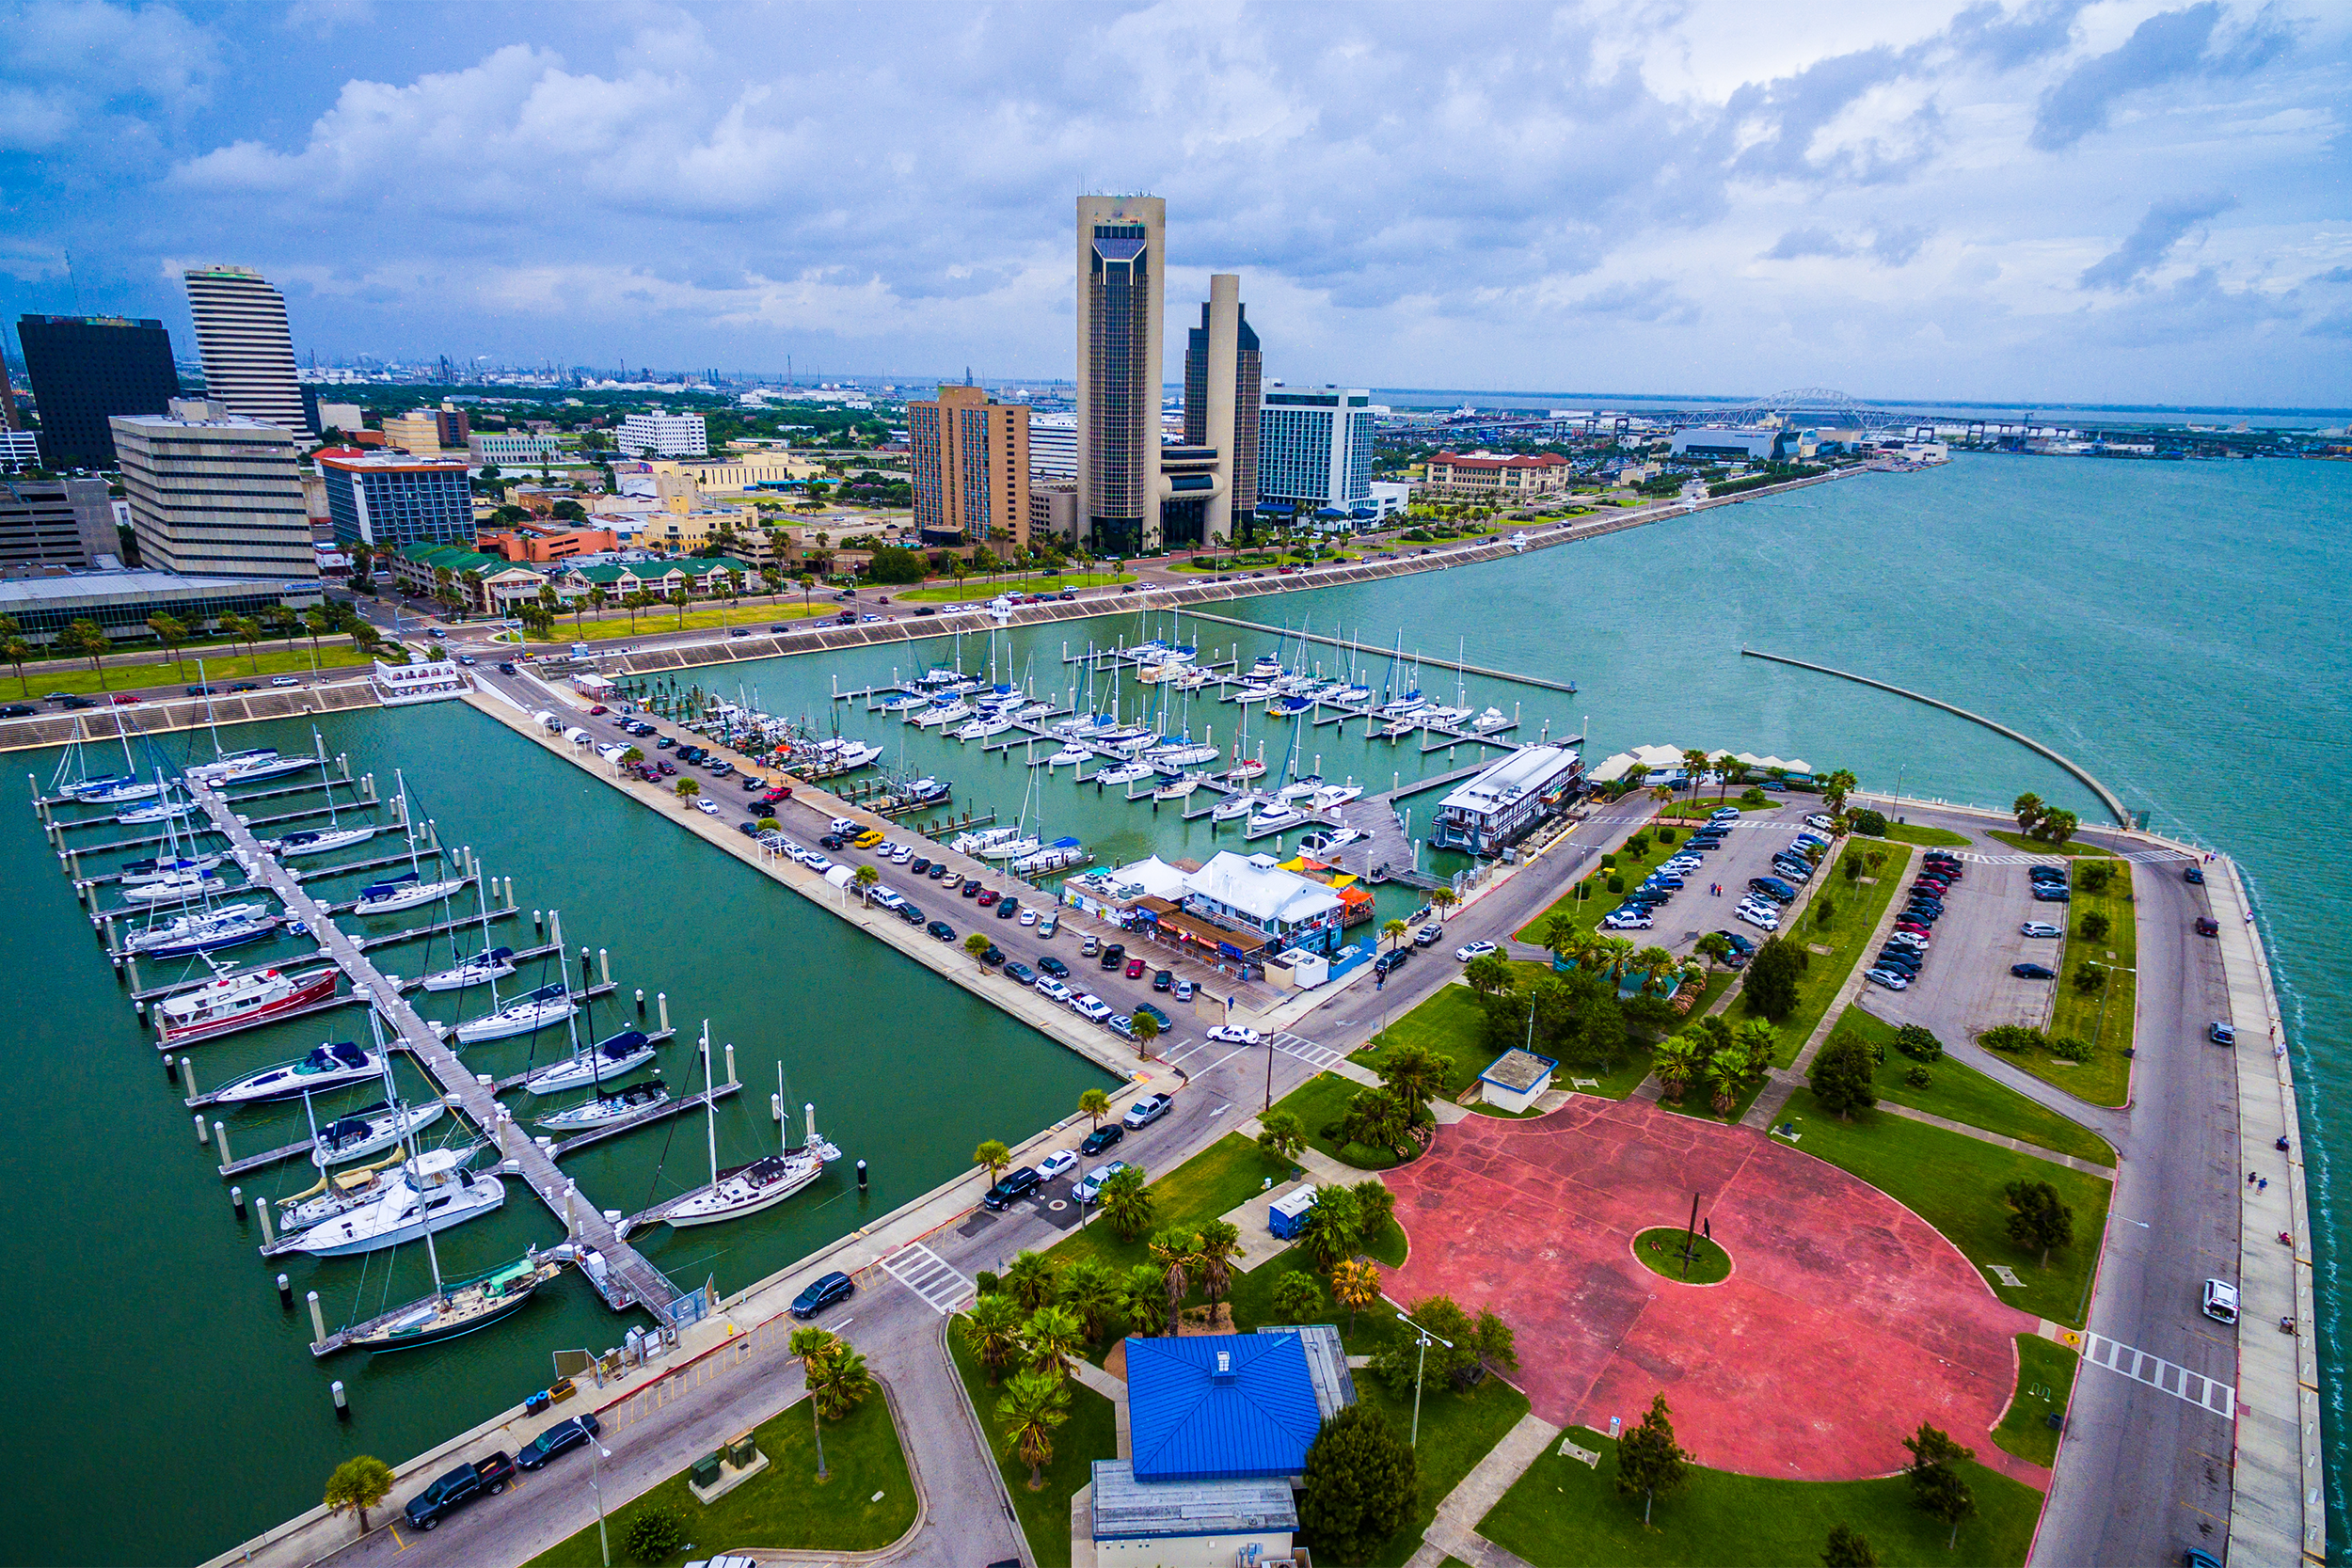
Cost of ownership and maintenance: 11th Traffic infrastructure: 7th Safety: 21st Access to vehicles and maintenance: 79th Corpus Christi (in a tie with Reno, Nevada) has the lowest average parking rate, at $1 for every two hours (compare that with New York’s record-setting average of about $40).
2nd Best: Raleigh, North Carolina
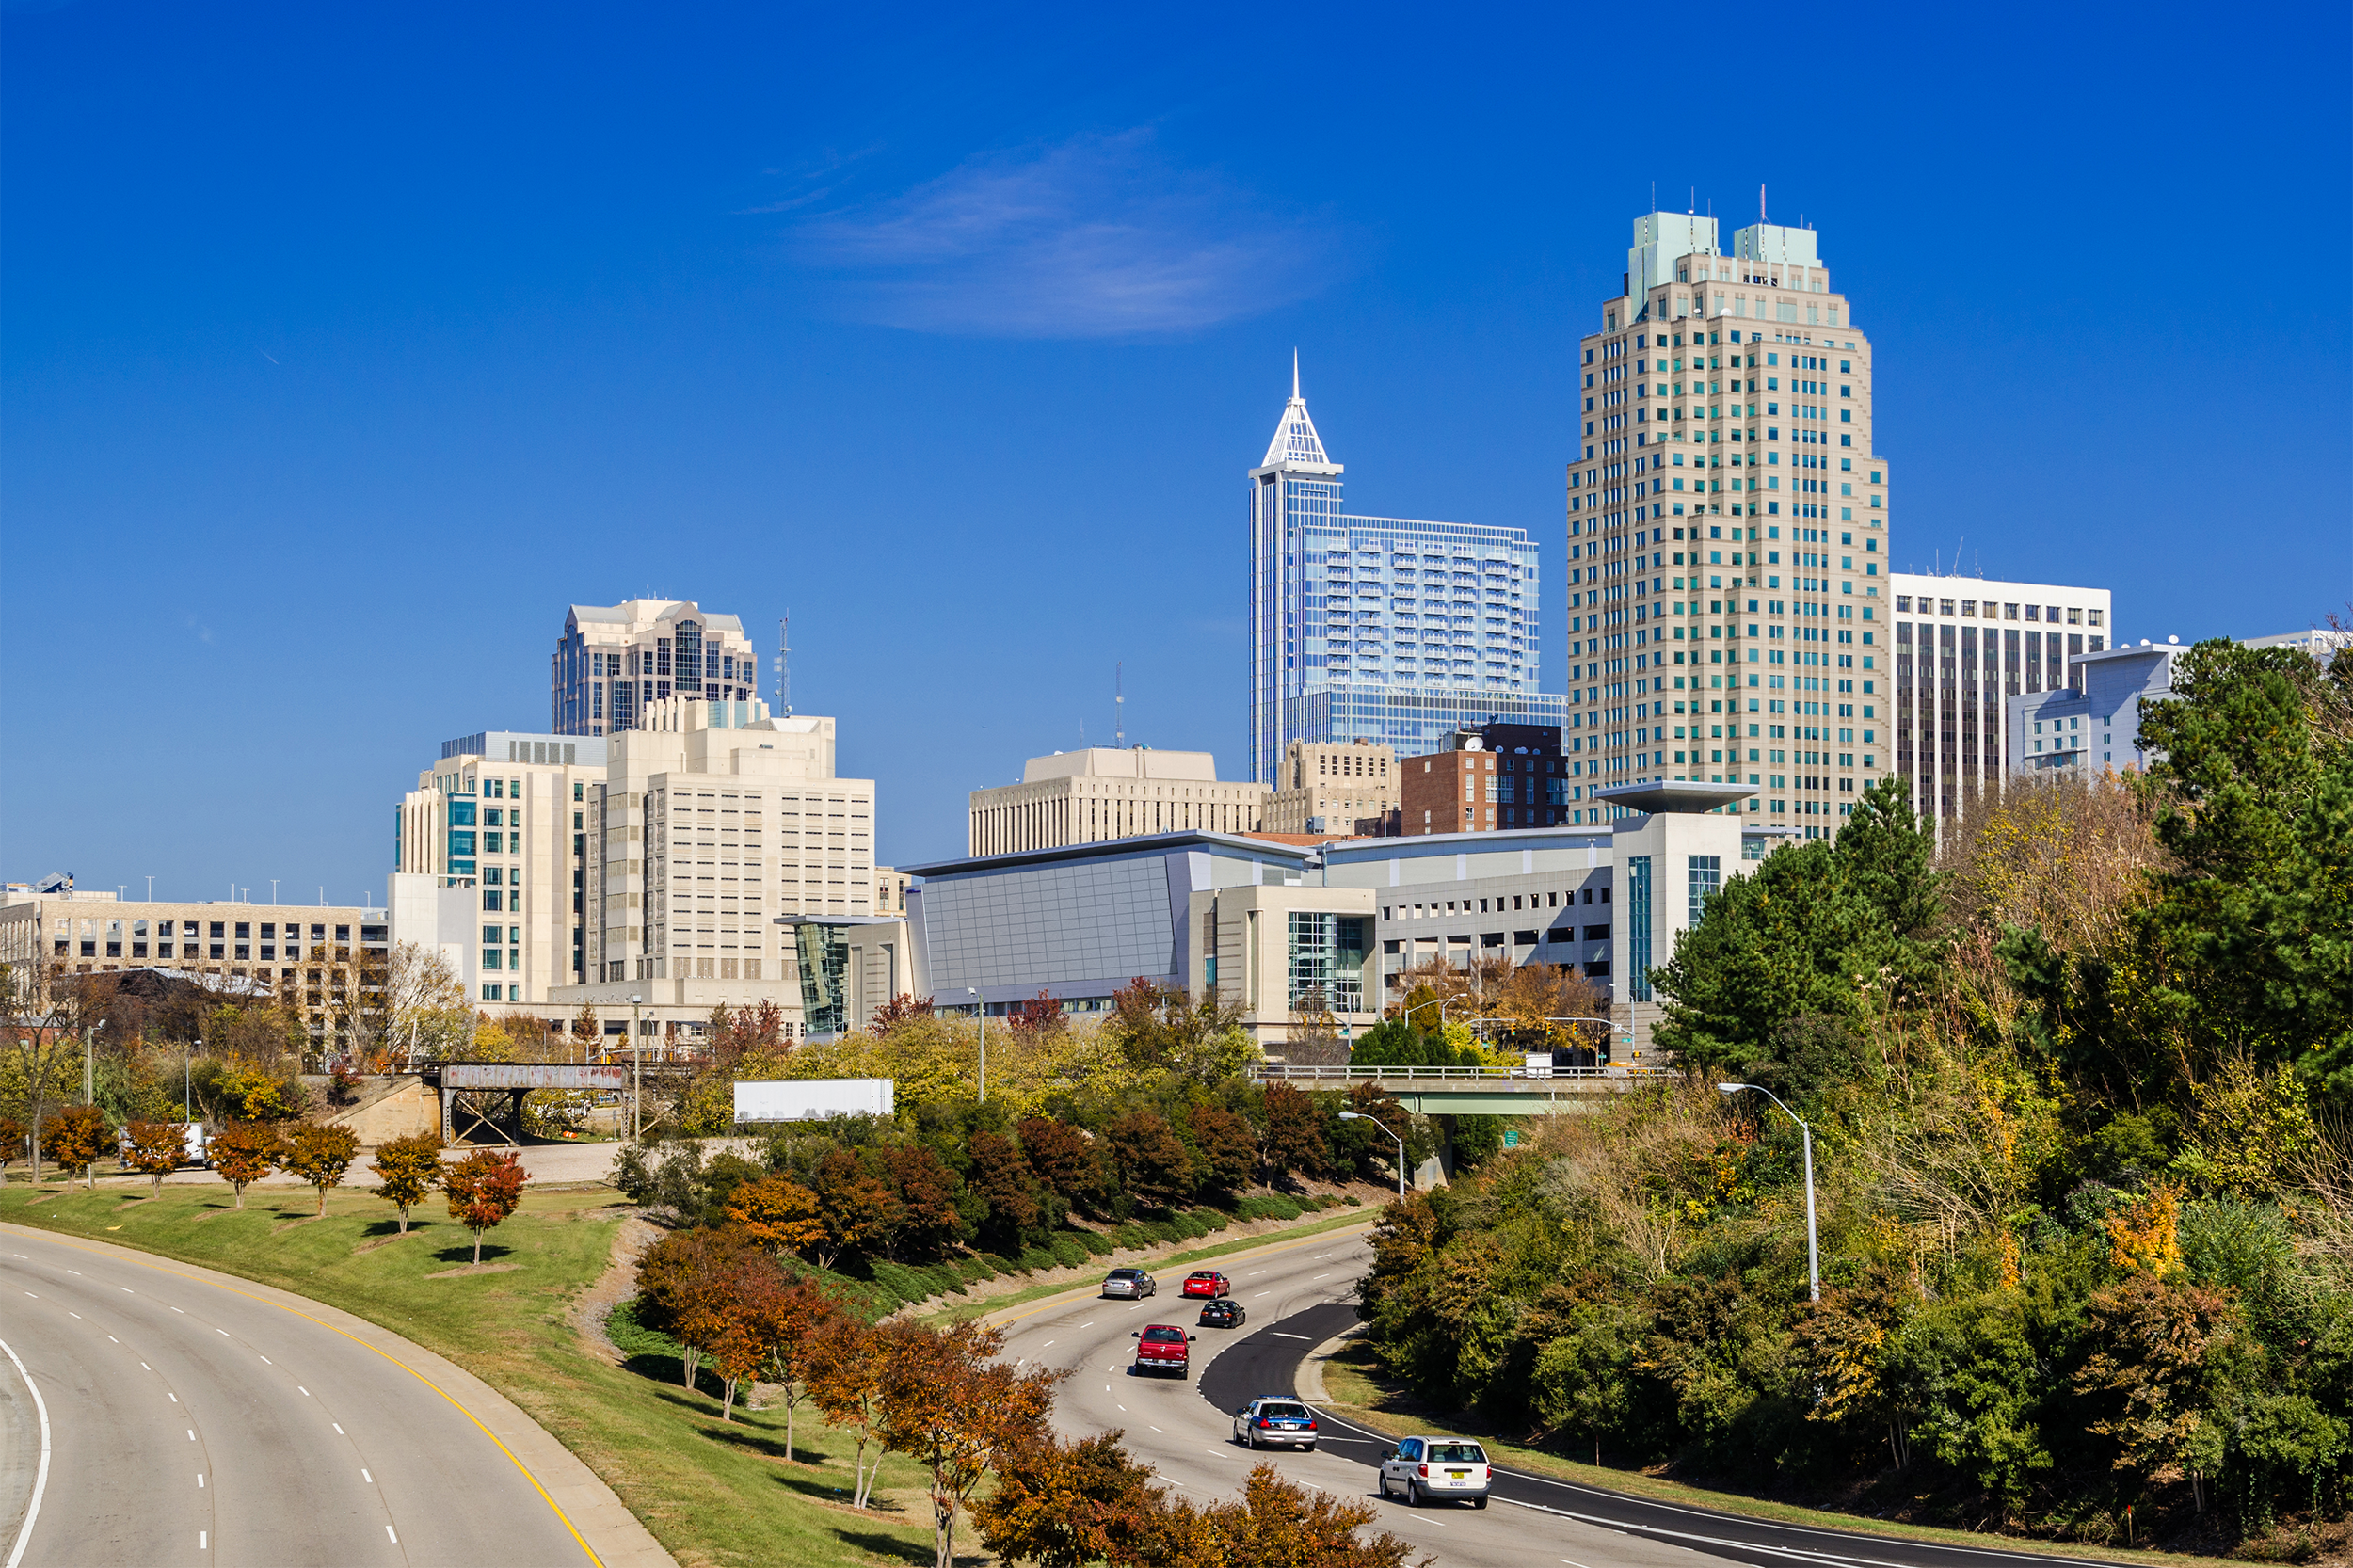
Cost of ownership and maintenance: 3rd Traffic infrastructure: 22nd Safety: 8th Access to vehicles and maintenance: 52nd Having some of the lowest auto maintenance rates in the country is only one reason Raleigh’s good for drivers. (It’s also good for allergy sufferers, lovers of craft beer, entrepreneurs, seniors looking for work …)
Related: The Best and Worst Cities in America for Making Ends Meet
Best: Lincoln, Nebraska
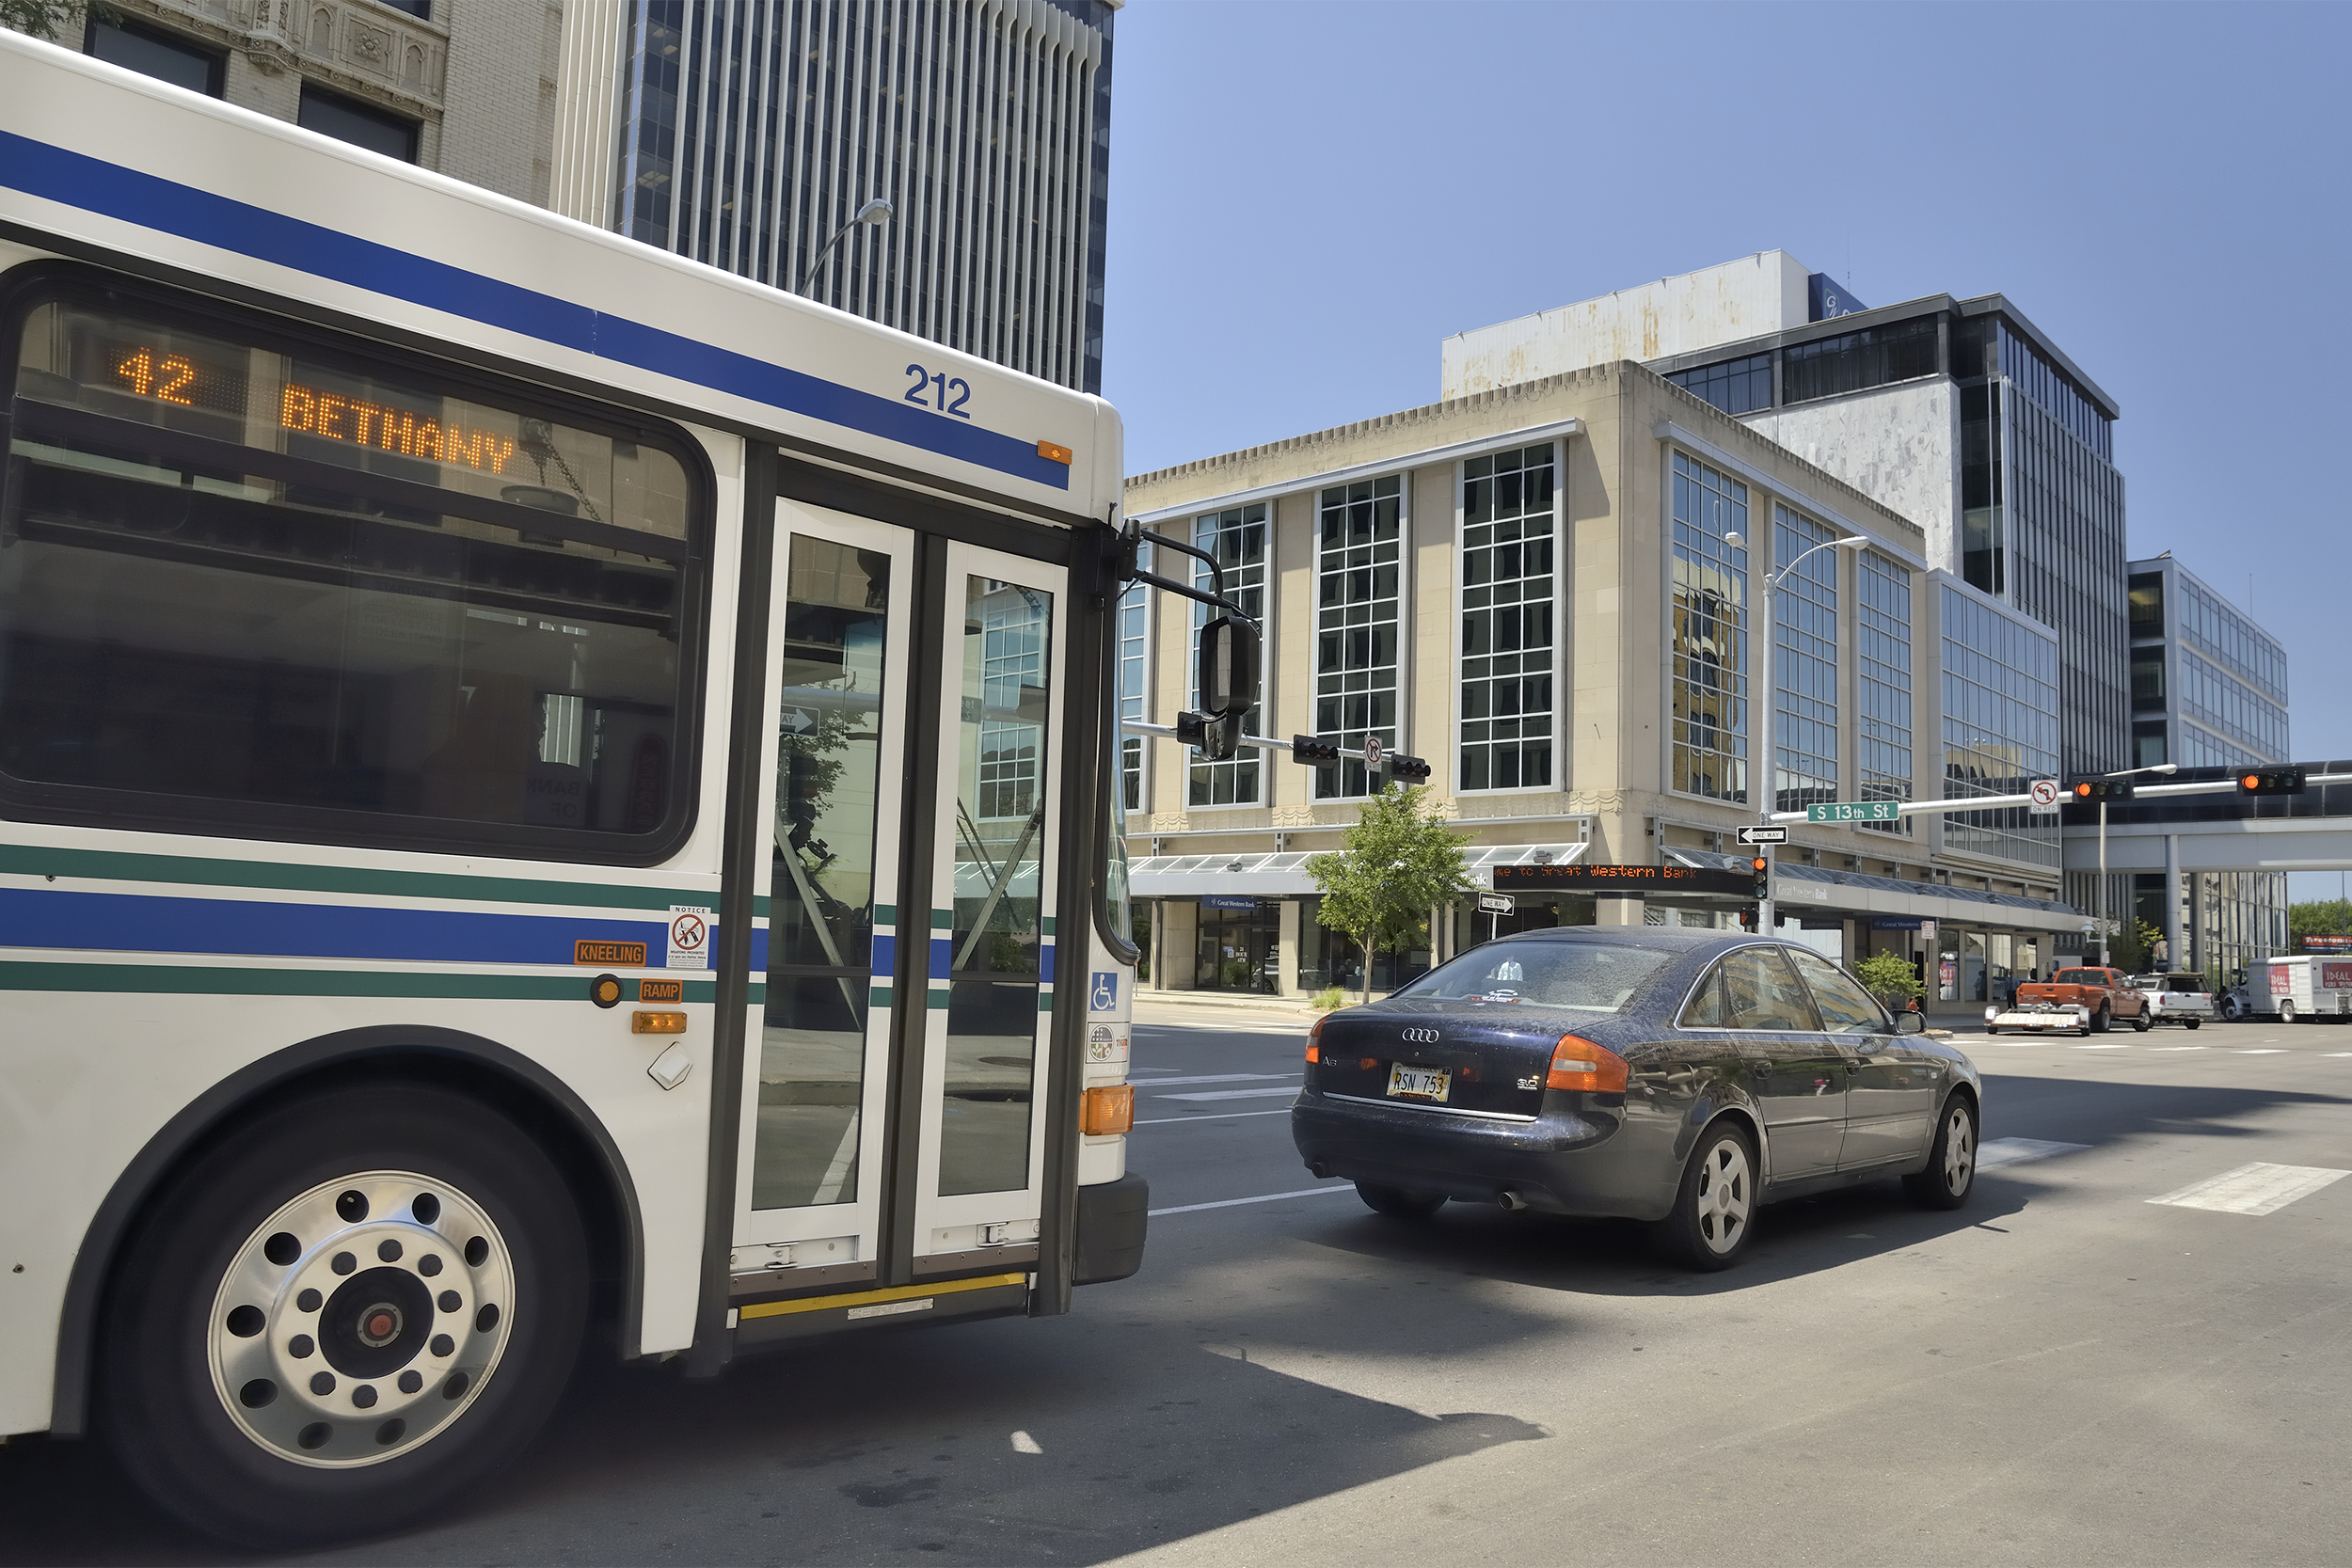
Cost of ownership and maintenance: 4th Traffic infrastructure: 13th Safety: 5th Access to vehicles and maintenance: 83rd Lincoln is best overall for drivers, according to WalletHub, and a standout in terms of how little time they spend in traffic.