Car insurance is one of those bills you have to pay every month and hope you’ll never need. The state you live in can impact car insurance rates, but so can the city. Here are the major U.S. cities that have the lowest and highest rates for auto insurance.
Related: Car Insurance Discounts You Didn’t Know AboutMethodology
To determine how much auto insurance costs for the top 50 largest cities by number of households, the data analytics outfit doxoINSIGHTS used anonymous bill pay data. For this study, data was analyzed from over 7 million customers across locations, payments sources, and income brackets.
Related: These States Are the Worst for Car TheftOverall Auto Insurance Spending

The total market size for the auto insurance industry is a whopping $250 billion with an average annual cost of $1,929 for each U.S. household. Surprisingly, only 82% of households have insurance. While some households may not have a car, it also points to a large number of uninsured motorists who are putting themselves and others at risk on the roads.
For more smart auto stories, please sign up for our free newsletters.10th Least Expensive: San Francisco
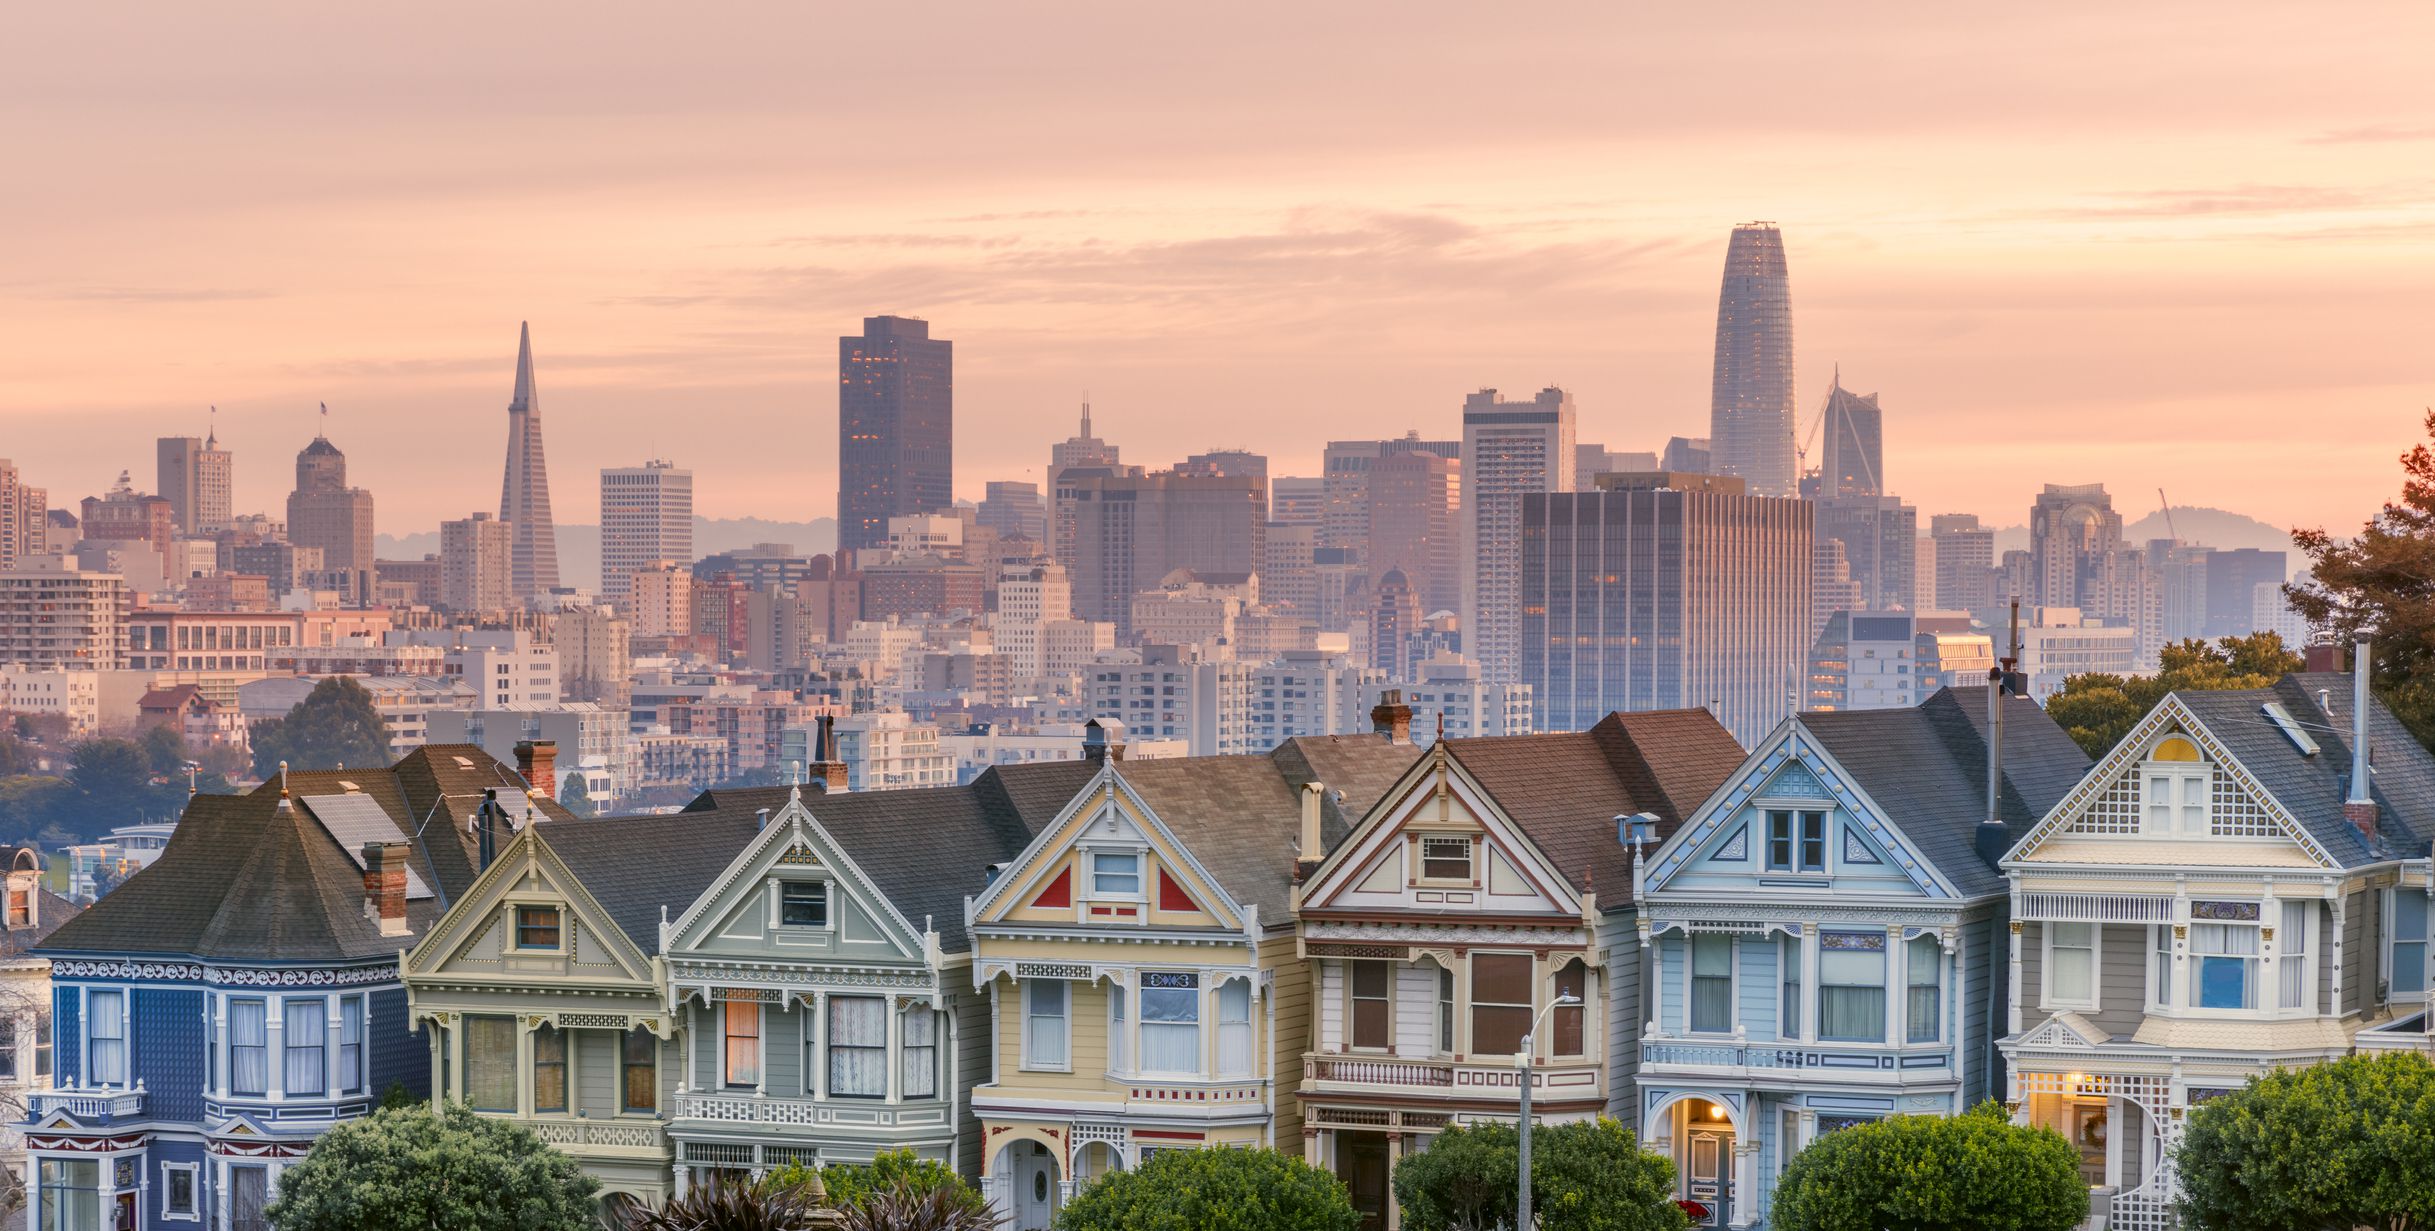
Average Monthly Bill: $151
Percentage of Households With This Bill: 69%
Average Per Household Cost Per Year: $1,250
The average per household cost in San Francisco is much lower than in many other cities because such a small percentage of households have an auto insurance bill.
Related: 12 Tips to Keep You from Buying Too Much Insurance9th Least Expensive: Albuquerque, New Mexico

Average Monthly Bill: $150
Percentage of Households With This Bill: 85%
Average Per Household Cost Per Year: $1,5308th Least Expensive: Tucson, Arizona
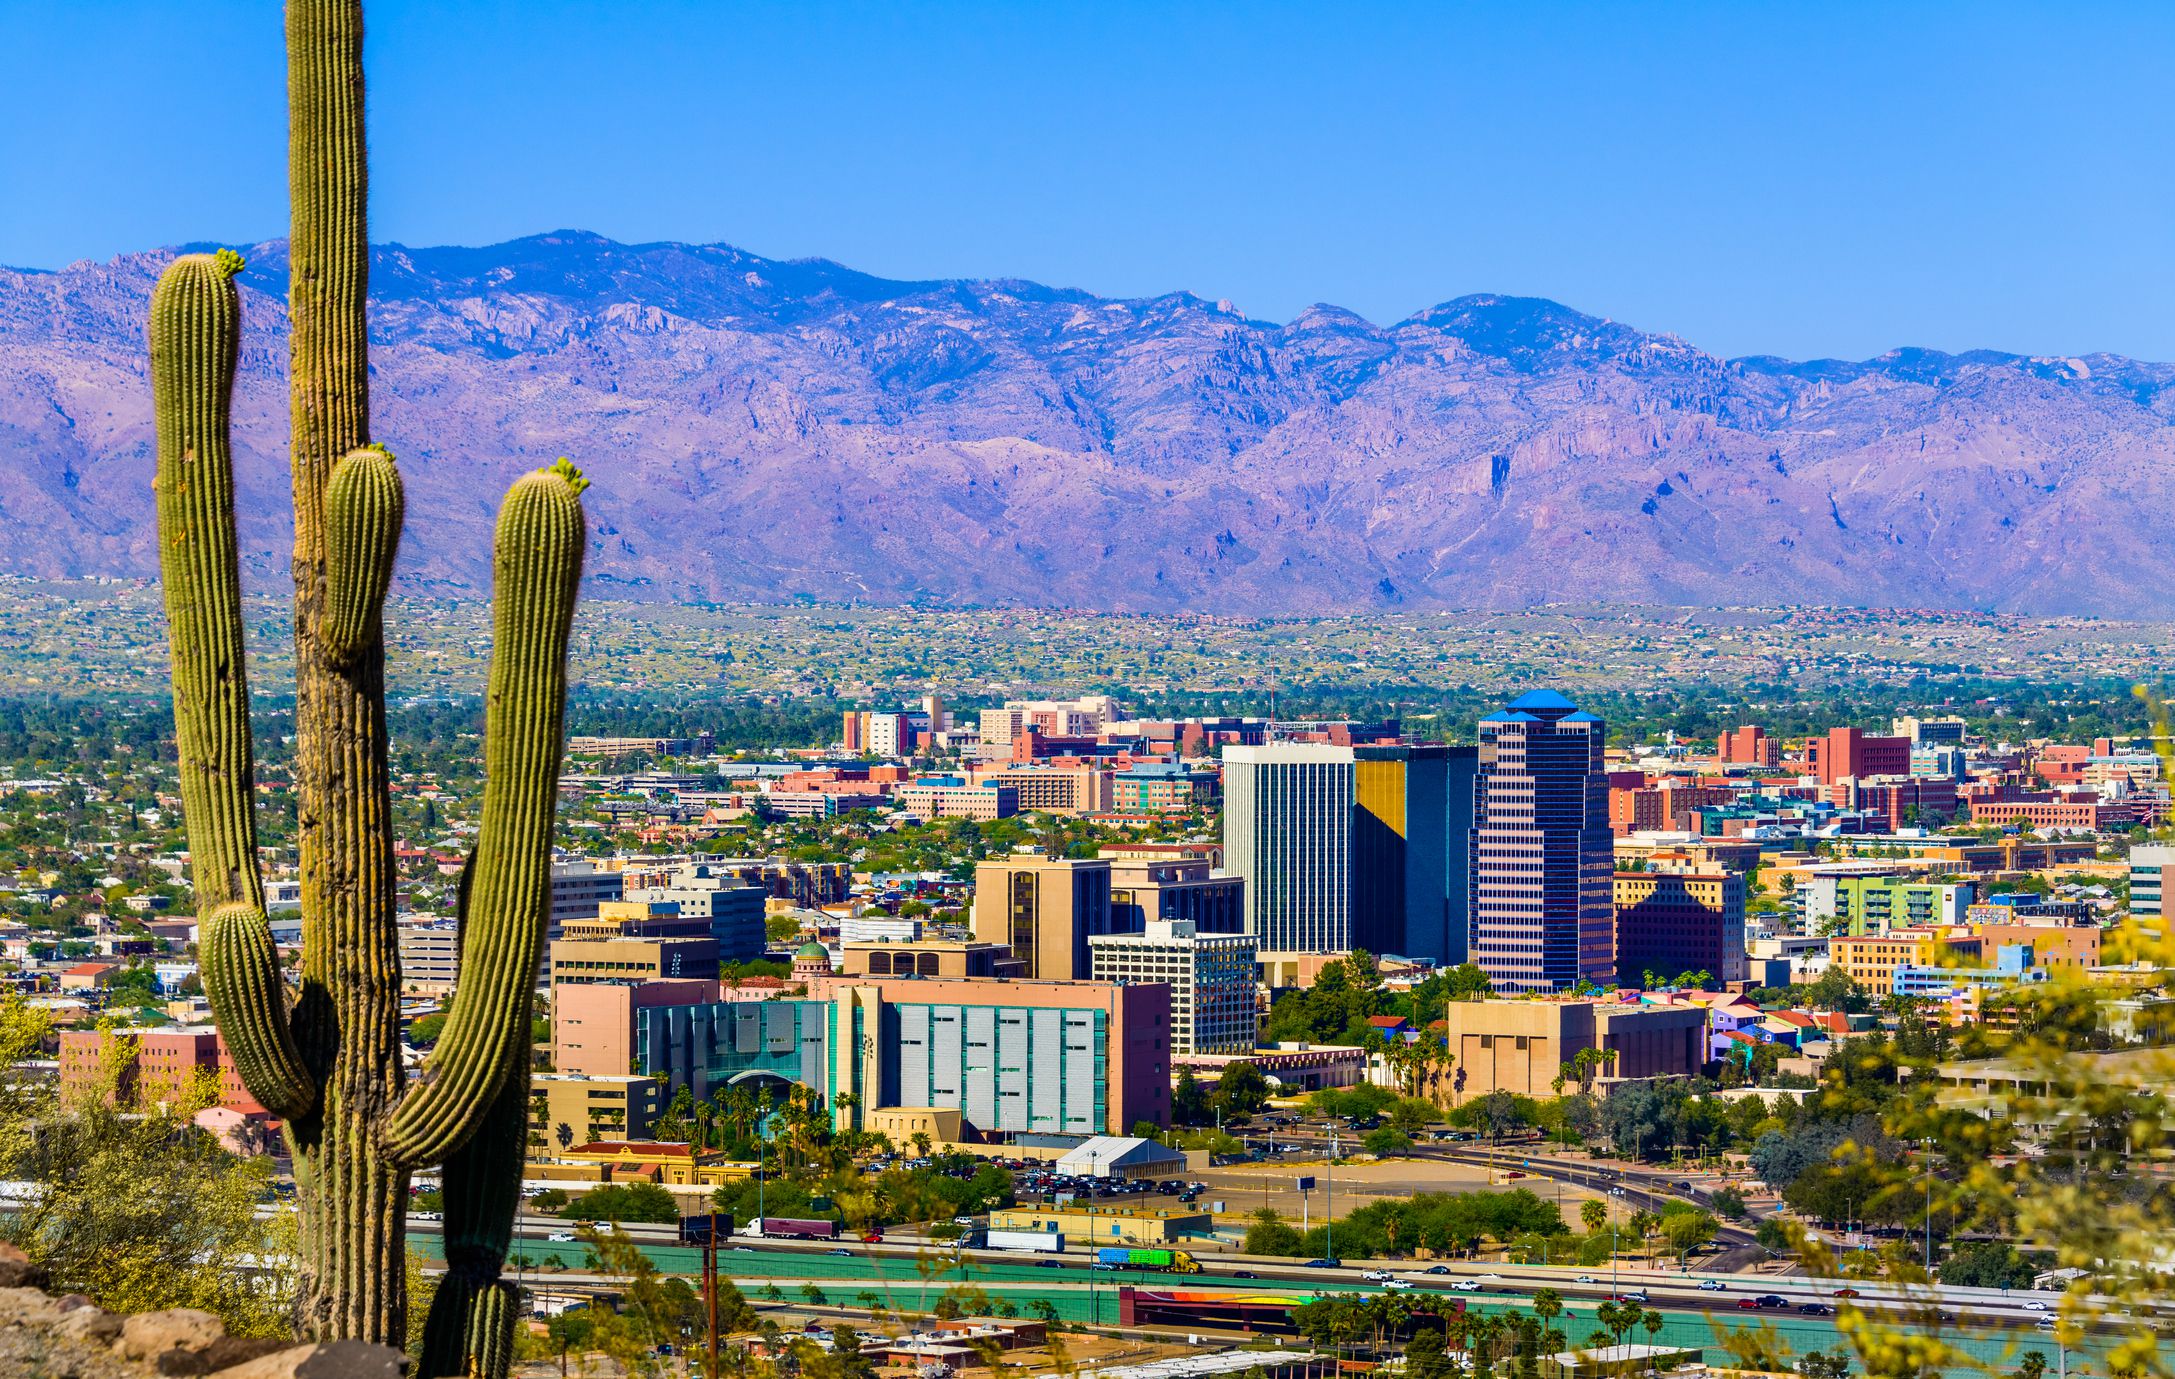
Average Monthly Bill: $146
Percentage of Households With This Bill: 82%
Average Per Household Cost Per Year: $1,437Trending on Cheapism


7th Least Expensive: San Antonio

Average Monthly Bill: $143
Percentage of Households With This Bill: 80%
Average Per Household Cost Per Year: $1,3736th Least Expensive: Kansas City, Missouri

Average Monthly Bill: $128
Percentage of Households With This Bill: 79%
Average Per Household Cost Per Year: $1,2135th Least Expensive: St. Paul, Minnesota

Average Monthly Bill: $123
Percentage of Households With This Bill: 81%
Average Per Household Cost Per Year: $1,196Sign up for our newsletter
4th Least Expensive: Sacramento, California

Average Monthly Bill: $123
Percentage of Households With This Bill: 72%
Average Per Household Cost Per Year: $1,063
Lower rates of insurance contribute to a lower annual cost per household than some cities where the monthly rate is higher.
3rd Least Expensive: Dallas

Average Monthly Bill: $122
Percentage of Households With This Bill: 80%
Average Per Household Cost Per Year: $1,1712nd Least Expensive: San Diego
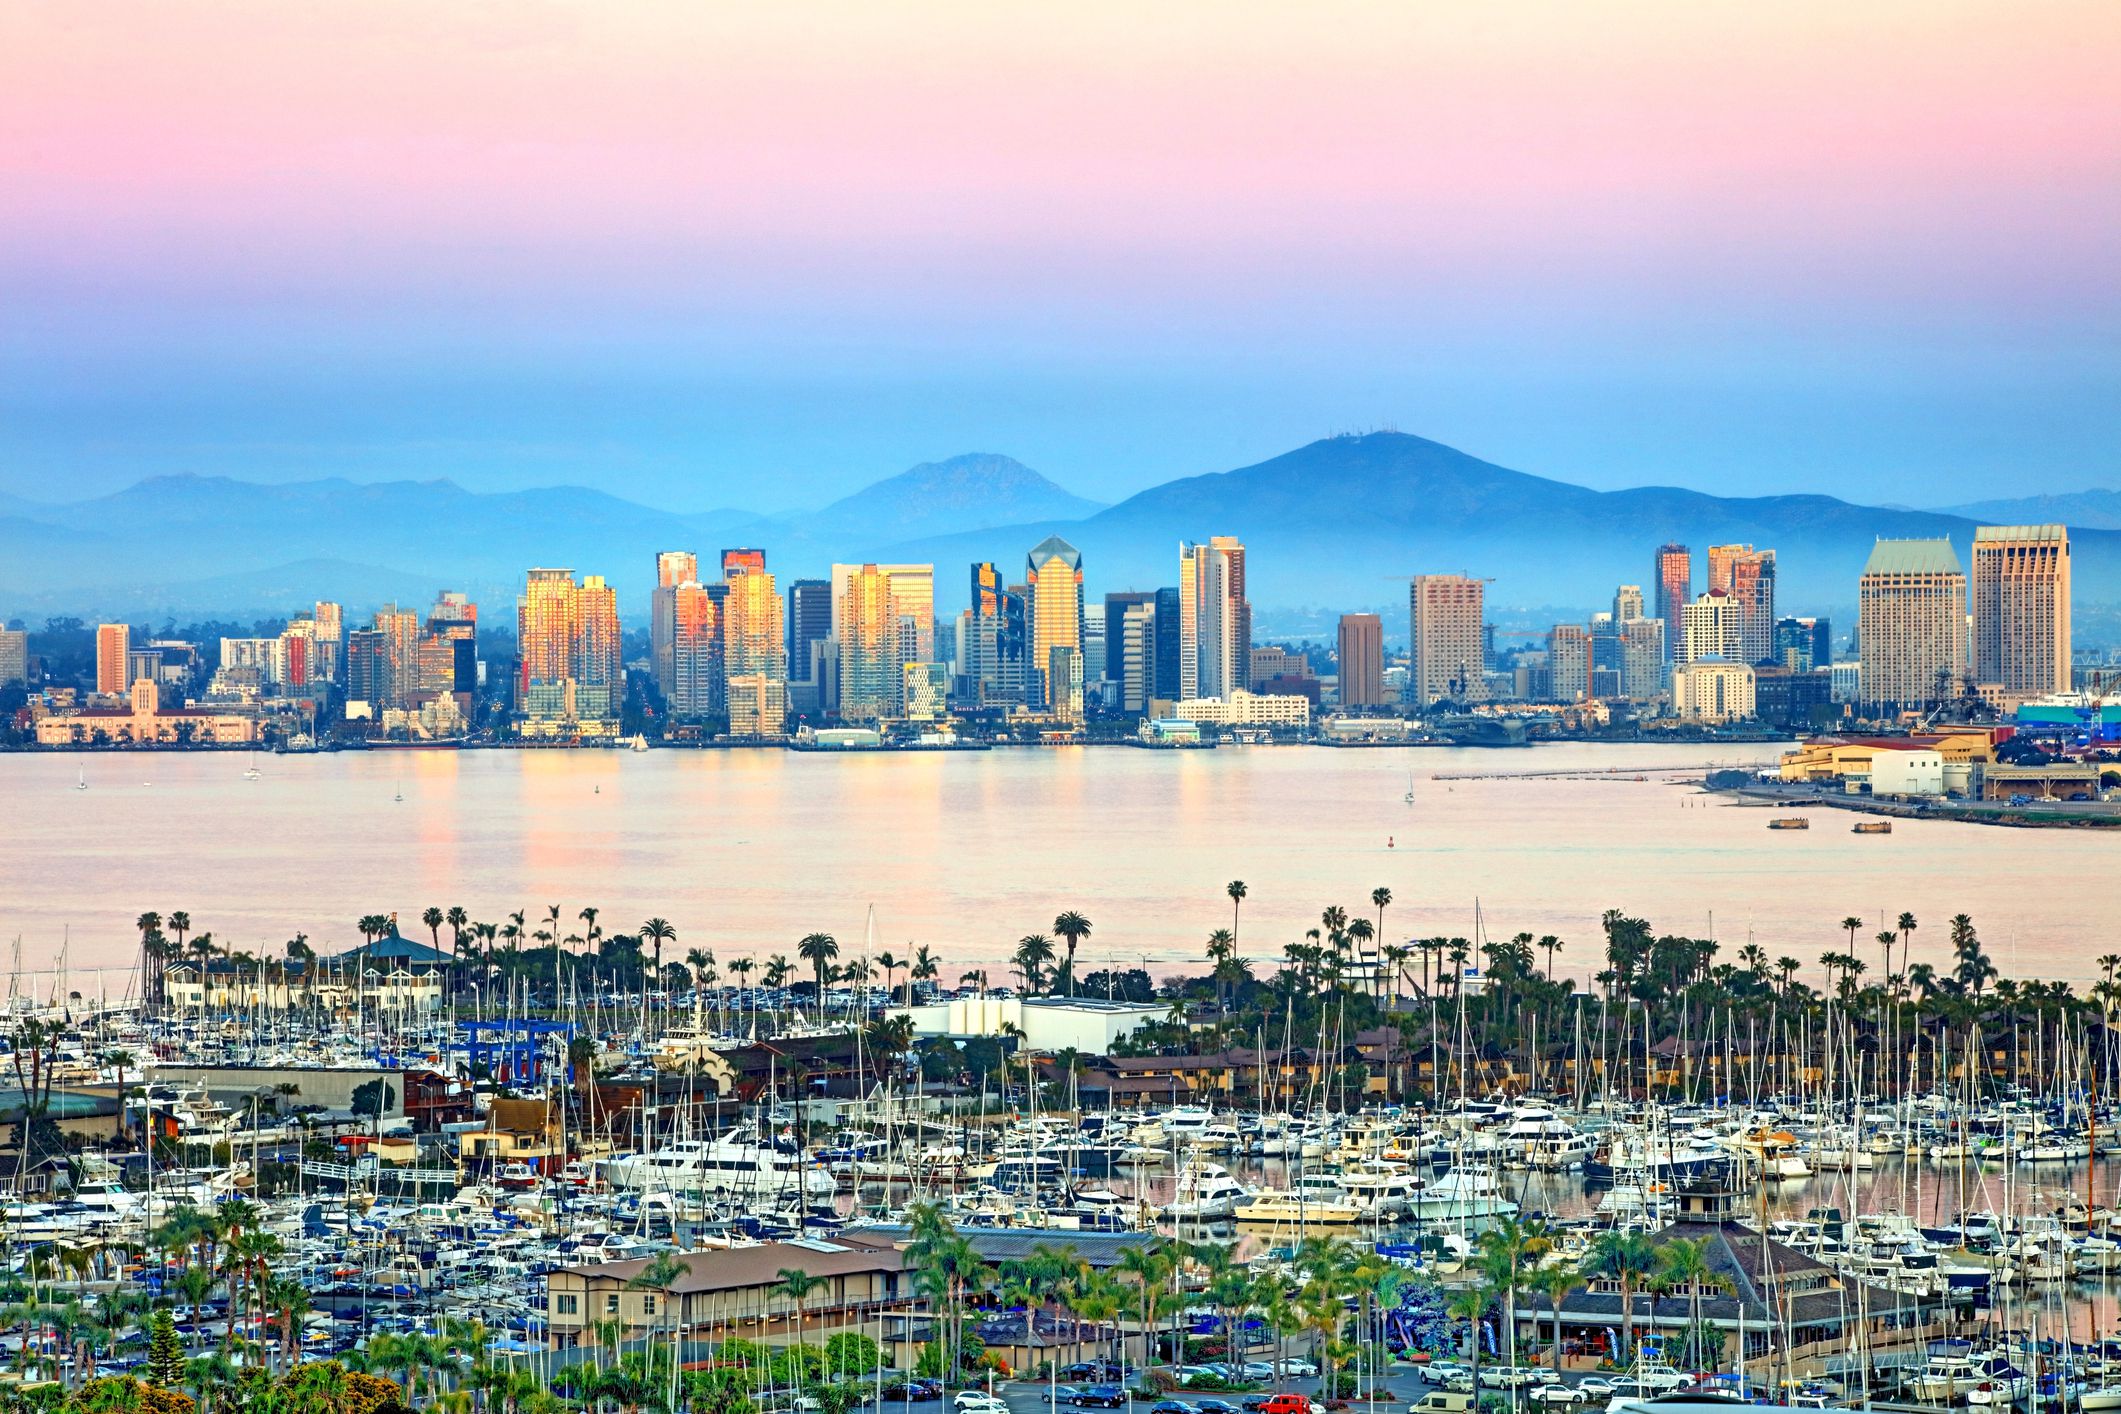
Average Monthly Bill: $120
Percentage of Households With This Bill: 82%
Average Per Household Cost Per Year: $1,181
It’s not too often a city in California makes the top of the list for something being the least expensive. Unfortunately for San Diego drivers, they had one of the sharpest increases in the last year, thanks in large part to inflation.Least Expensive: Minneapolis

Average Monthly Bill: $102
Percentage of Households With This Bill: 77%
Average Per Household Cost Per Year: $942
Despite sometimes treacherous winter driving conditions, Minnesota has some of the lower insurance rates for large cities with both Minneapolis and St. Paul coming in among the least expensive five cities.
10th Most Expensive (Tied): Austin, Texas

Average Monthly Bill: $228
Percentage of Households With This Bill: 79%
Average Per Household Cost Per Year: $2,161
Austin’s average annual cost is slightly lower than in Charlotte, North Carolina, (the city it’s tied with) given the lower percentage of insured households.
10th Most Expensive (Tied): Charlotte, North Carolina

Average Monthly Bill: $228
Percentage of Households With This Bill: 88%
Average Per Household Cost Per Year: $2,4089th Most Expensive: Fort Worth, Texas

Average Monthly Bill: $231
Percentage of Households With This Bill: 86%
Average Per Household Cost Per Year: $2,4398th Most Expensive: Atlanta
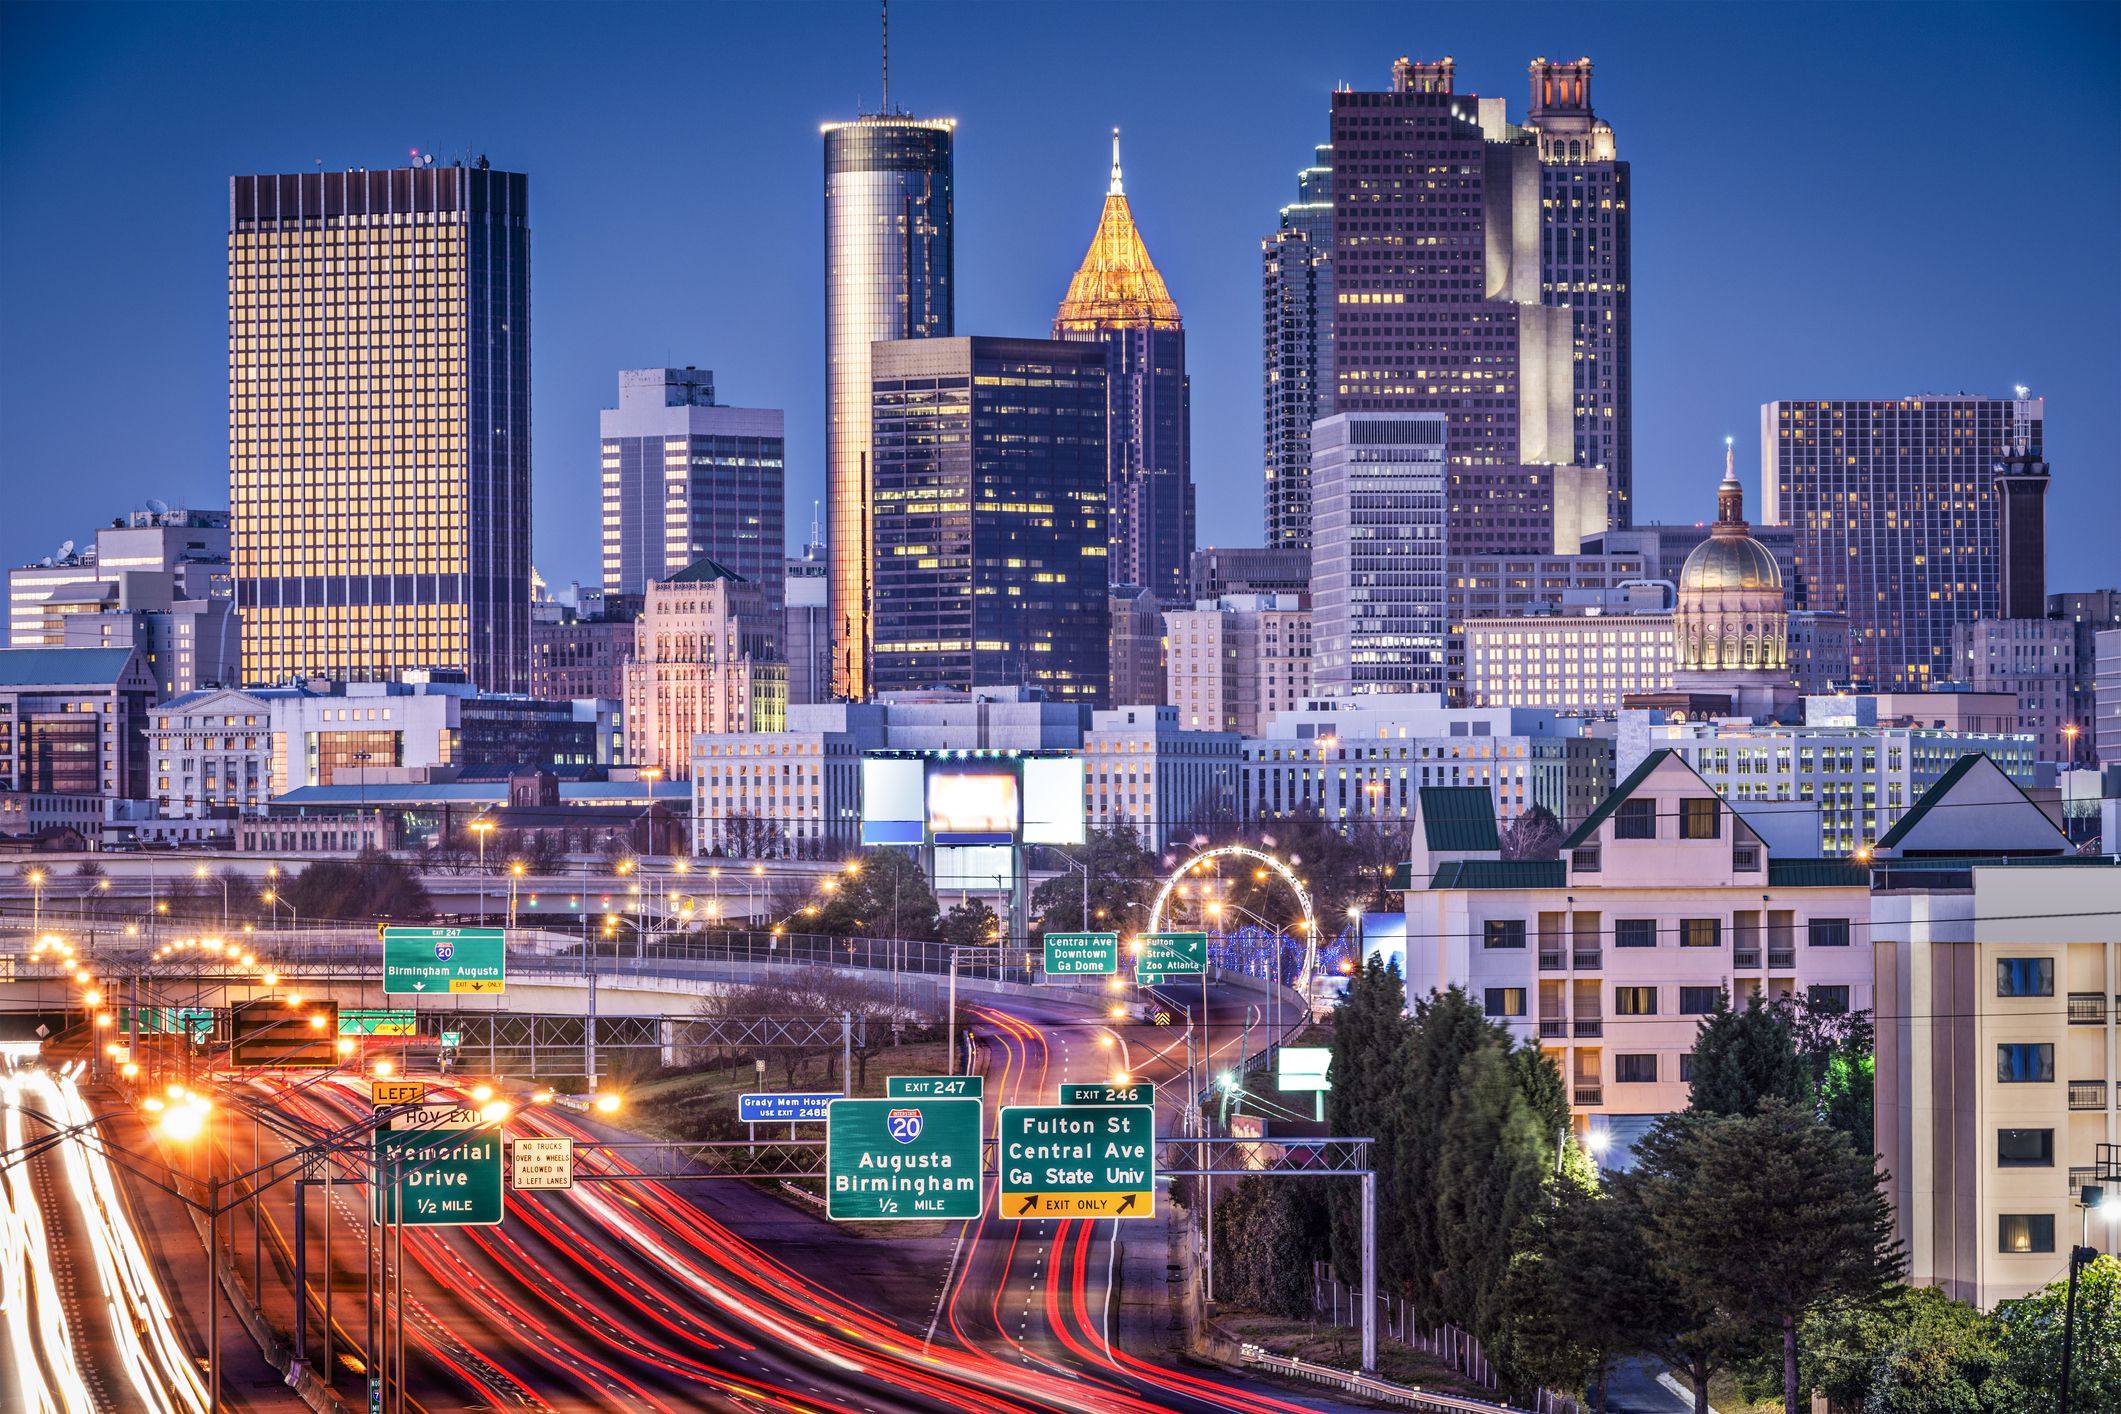
Average Monthly Bill: $247
Percentage of Households With This Bill: 83%
Average Per Household Cost Per Year: $2,4607th Most Expensive: Birmingham, Alabama

Average Monthly Bill: $248
Percentage of Households With This Bill: 87%
Average Per Household Cost Per Year: $2,5896th Most Expensive: Detroit

Average Monthly Bill: $252
Percentage of Households With This Bill: 79%
Average Per Household Cost Per Year: $2,389
Since fewer Detroiters have auto insurance, the average annual cost per household is lower despite higher monthly bills than some other cities.
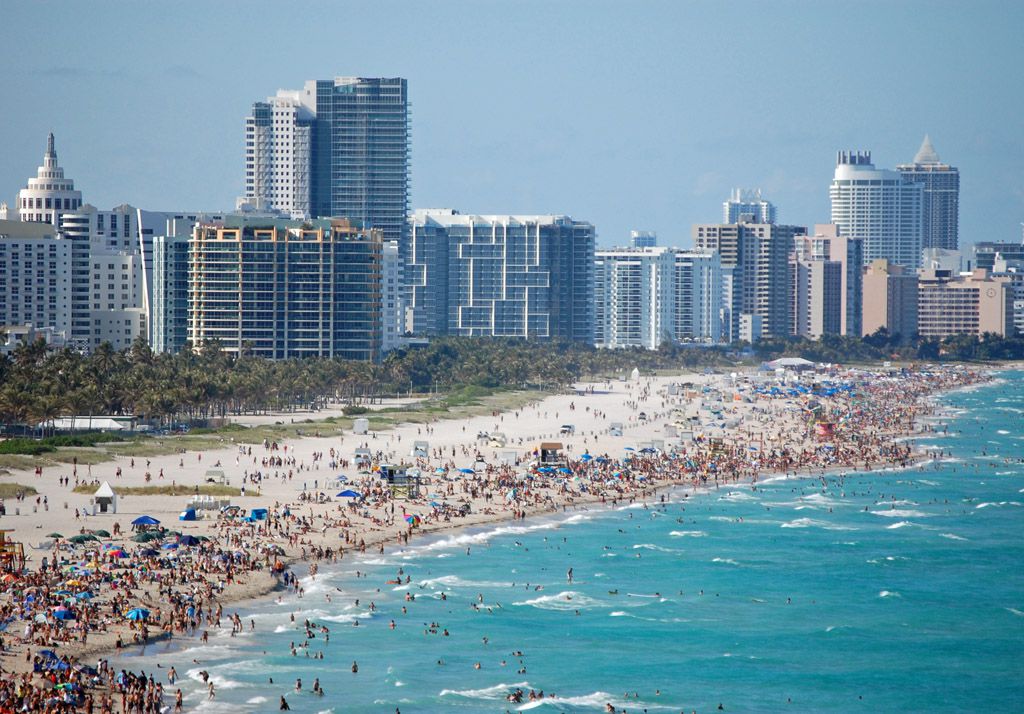
5th Most Expensive: Fort Lauderdale, Florida
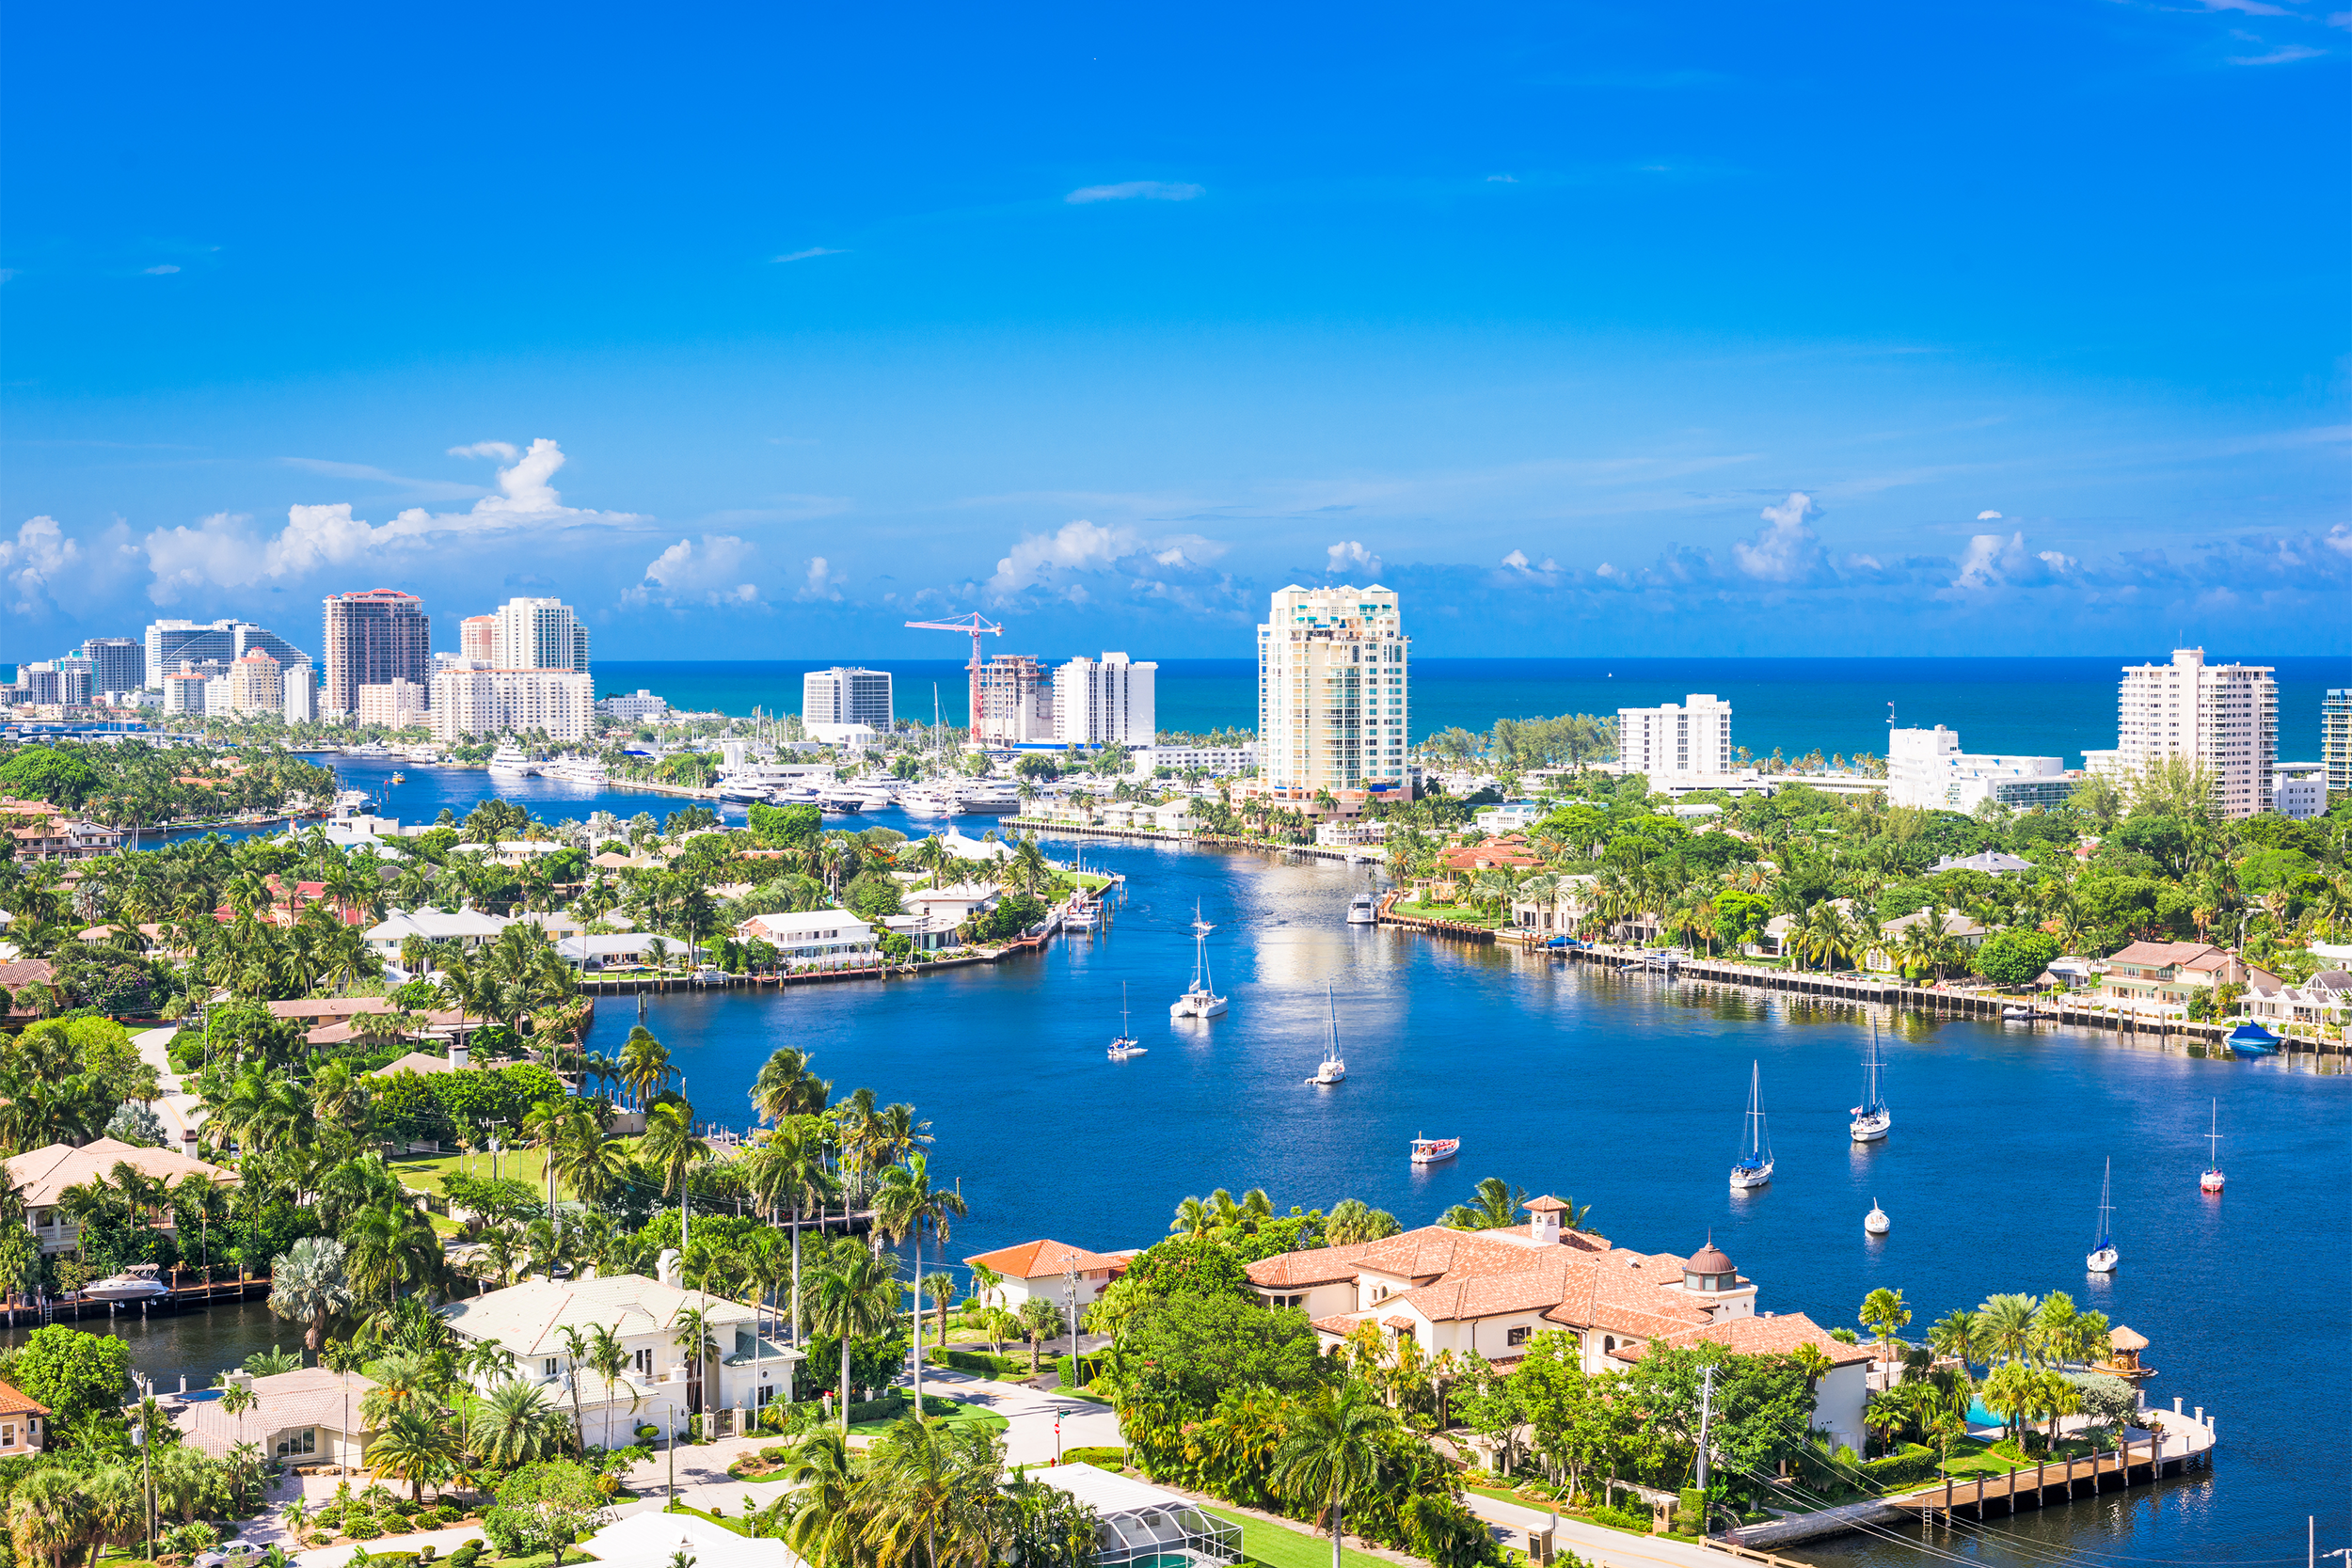
Average Monthly Bill: $262
Percentage of Households With This Bill: 91%
Average Per Household Cost Per Year: $2,861
Since most people in Fort Lauderdale have auto insurance, the average annual cost is higher despite having a slightly lower monthly cost than Portland.
4th Most Expensive: Portland, Oregon

Average Monthly Bill: $263
Percentage of Households With This Bill: 87%
Average Per Household Cost Per Year: $2,7463rd Most Expensive: Tampa, Florida

Average Monthly Bill: $339
Percentage of Households With This Bill: 85%
Average Per Household Cost Per Year: $3,458
Interstate 4, which connects Tampa to Orlando, is one of the deadliest highways in the United States, which likely plays a role in the higher insurance rates.2nd Most Expensive: Miami

Average Monthly Bill: $370
Percentage of Households With This Bill: 81%
Average Per Household Cost Per Year: $3,596
Part of the reason for Miami’s high costs is likely related to the fact that Florida requires individuals to have no-fault insurance, which is more costly for insurance companies.
Most Expensive: New York

Average Monthly Bill: $448
Percentage of Households With This Bill: 67%
Average Per Household Cost Per Year: $3,602
New York’s astronomical monthly rates also lead to the highest annual average per household cost despite only 67% of New York households having this bill. In New York, it seems it pays to take cabs for multiple reasons.