
It’s easy to think of life expectancy as a fixed number—around 80 years in many countries today. But that figure is shaped by so many things: the year you were born, where you live and the circumstances you grew up in. And that number has moved a lot over time. Here, we unpack how life expectancy has changed across generations, what factors have shaped it and why the numbers vary depending on when you were born.
Life expectancy tells the story of how America has changed, from the struggles of the 1940s to the steady progress that followed. Here are some key takeaways to know:
- In 1940, the average American could expect to live just under 63 years, and women outlived men by nearly five years. Vaccines, public health programs, safer workplaces, and medical breakthroughs pushed that number higher over the decades, while social and economic shifts played their part, too.
- By 1980, life expectancy had climbed above 73 years, marking one of the most dramatic health improvements in the nation’s history.
- After years of uneven progress, 2023 brought renewed optimism. According to the most recent CDC data, U.S. life expectancy rose to 78.4 years as mortality rates improved across most age groups and demographics.
Yet the story of longevity is rarely straightforward. Some states now approach an average lifespan of 80 years, while others still lag behind by nearly a decade, and women continue to outlive men by more than five years on average.
This year-by-year look traces how medicine, policy, and everyday life have shaped how long Americans were expected to live the year they were born, and what those numbers reveal about the country’s past and present.
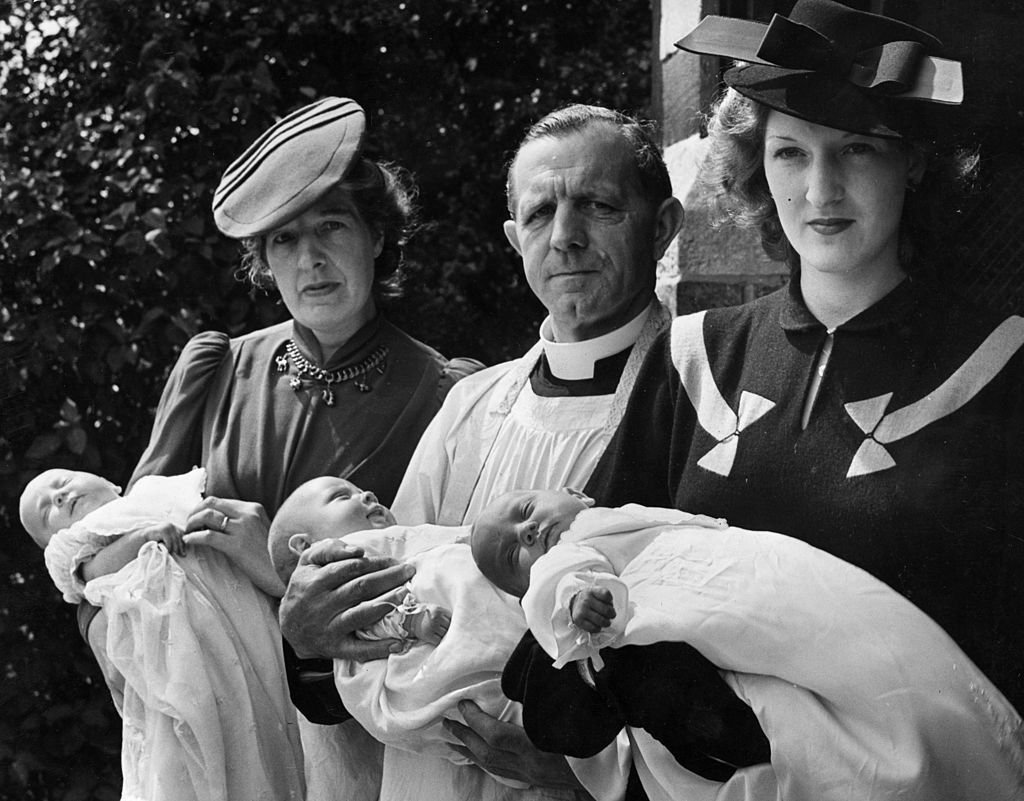
1940

Overall life expectancy: 62.9
Women: 65.2
Men: 60.8
The United States began the ’40s on an upswing, with life expectancy up sharply from 58.5 years in 1936, when the nation was still struggling with the economic devastation of the Great Depression. The 1940s would also bring significant public health landmarks, including the mass production of penicillin and the DTP shot, which combined the pertussis, diphtheria, and tetanus vaccines.
1941

Overall life expectancy: 64.8
Women: 66.8
Men: 63.1
1942
Overall life expectancy: 66.2
Women: 67.9
Men: 64.7
1943

Overall life expectancy: 63.3
Women: 64.4
Men: 62.4
Life expectancy dropped almost three years from 1942 to 1943. Though World War II may have driven a decline, a change in how life expectancy was calculated beginning in 1948 may have made the drop look more dramatic than it really was, scholars say.
1944

Overall life expectancy: 65.2
Women: 66.8
Men: 63.6
Trending on Cheapism


1945

Overall life expectancy: 65.9
Women: 67.9
Men: 63.6
1946

Overall life expectancy: 66.7
Women: 69.4
Men: 64.4
1947

Overall life expectancy: 66.8
Women: 69.7
Men: 64.4
Sign up for our newsletter
1948

Overall life expectancy: 67.2
Women: 69.9
Men: 64.6
1949

Overall life expectancy: 68
Women: 70.7
Men: 65.2
1949 marked the first year women’s life expectancy eclipsed 70 — a milestone men would not reach for another three decades. Experts have long documented that women tend to outlive men, attributing the difference to several factors. Among them: Men take more risks, are less likely to seek medical care, and are more likely to die of heart disease and suicide. 1949 was also the last time the U.S. saw an outbreak of smallpox.
1950

Overall life expectancy: 68.2
Women: 71.1
Men: 65.6
1951

Overall life expectancy: 68.4
Women: 71.4
Men: 65.6
1952

Overall life expectancy: 68.6
Women: 71.6
Men: 65.8
1953

Overall life expectancy: 68.8
Women: 72
Men: 66
1954
Overall life expectancy: 69.6
Women: 72.8
Men: 66.7
1955

Overall life expectancy: 69.6
Women: 72.8
Men: 66.7
In 1955, a nationwide push to inoculate children against polio began after trials found Dr. Jonas Salk’s vaccine to be safe and effective. New polio cases dropped to less than 6,000 in 1957 from 58,000 in 1952.
1956

Overall life expectancy: 69.7
Women: 72.9
Men: 66.7
1957
Overall life expectancy: 69.5
Women: 72.7
Men: 66.4
Though it was nowhere near as devastating as the 1918 pandemic that killed 50 million worldwide, the flu killed more than 116,000 in the United States and 1.1 million worldwide in 1957-58.
1958

Overall life expectancy: 69.6
Women: 72.9
Men: 66.6
1959

Overall life expectancy: 69.9
Women: 73.2
Men: 66.8
1960

Overall life expectancy: 69.7
Women: 73.1
Men: 66.6
By 1960, life expectancy numbers had settled into a long-term pattern of slow but steady growth compared with more dramatic jumps at the beginning of the century. From 1950 to 1960, life expectancy grew 1.5 years, compared with a jump of more than five years from 1940 to 1950, more than three years from 1930 to 1940, and more than five years from 1920 to 1930.
1961
Overall life expectancy: 70.2
Women: 73.6
Men: 67.1
1962
Overall life expectancy: 70.1
Women: 73.5
Men: 66.9
1963
Overall life expectancy: 69.9
Women: 73.4
Men: 66.6
1964

Overall life expectancy: 70.2
Women: 73.7
Men: 66.8
The U.S. government made waves in 1964 when the surgeon general released a landmark report that said cigarettes caused lung and throat cancer in men, and likely caused lung cancer in women.
1965

Overall life expectancy: 70.2
Women: 73.8
Men: 66.8
1966

Overall life expectancy: 70.2
Women: 73.9
Men: 66.7
1967

Overall life expectancy: 70.5
Women: 74.3
Men: 67
1968

Overall life expectancy: 70.2
Women: 74.1
Men: 66.6
About a decade after the 1957-58 pandemic, yet another flu pandemic killed about 100,000 people in the U.S. and more than 1 million worldwide.
1969

Overall life expectancy: 70.5
Women: 74.4
Men: 66.8
1970
Overall life expectancy: 70.8
Women: 74.7
Men: 67.1
Life expectancy was relatively flat in the ’60s, rising less than a year from 1960 to 1970. Women added about 18 months to their lifespans, while men added only half a year. The ’60s also brought three significant vaccines against measles, mumps, and rubella, which were eventually combined into the MMR shot in 1971.
1971

Overall life expectancy: 71.1
Women:75
Men: 67.4
1972

Overall life expectancy: 71.2
Women: 75.1
Men: 67.4
1973

Overall life expectancy: 71.4
Women: 75.3
Men: 67.6
1974

Overall life expectancy: 72
Women: 75.9
Men: 68.2
1975
Overall life expectancy: 72.6
Women: 76.6
Men: 68.8
1976

Overall life expectancy: 72.9
Women: 76.8
Men: 69.1
1977

Overall life expectancy: 73.3
Women: 77.2
Men: 69.5
1978

Overall life expectancy: 73.5
Women: 77.3
Men: 69.6
1979

Overall life expectancy: 73.9
Women: 77.8
Men: 70
1980

Overall life expectancy: 73.7
Women: 77.4
Men: 70
A particularly deadly flu season again was to blame for the drop in life expectancy in 1980, the nation’s first since 1968.
1981

Overall life expectancy: 74.1
Women: 77.8
Men: 70.4
1982

Overall life expectancy: 74.5
Women: 78.1
Men: 70.8
1983
Overall life expectancy: 74.6
Women: 78.1
Men: 71
1984

Overall life expectancy: 74.7
Women: 78.2
Men: 71.1
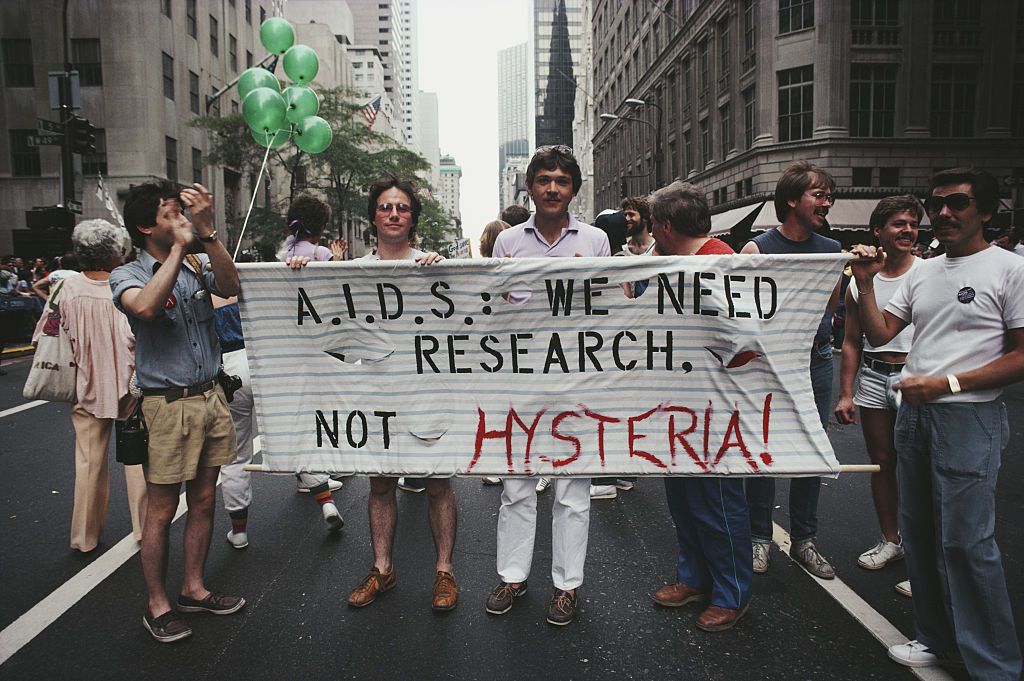
Three years after the CDC identified the first-known cluster of AIDS cases in the U.S. in 1981, researchers determined the cause of the disease: HIV. The first commercially available HIV test became available in 1985, and the first antiretroviral to fight HIV followed in 1987.
1985

Overall life expectancy: 74.7
Women: 78.2
Men: 71.1
In 1985, New York became the first state to require drivers to wear seat belts or risk a fine. Every state but New Hampshire eventually followed suit. In the early ’80s, seat belt use was only about 14%; today, it’s about 90%.
1986

Overall life expectancy: 74.7
Women: 78.2
Men: 71.2
1987

Overall life expectancy: 74.9
Women: 78.3
Men: 71.4
This year marked a major milestone for the fight against heart disease, when lovastatin became the first such cholesterol-lowering drug approved for commercial use in the U.S. Several other statins followed, including familiar names such as atorvastatin (perhaps better known as Lipitor).
1988

Overall life expectancy: 74.9
Women: 78.3
Men: 71.4
1989

Overall life expectancy: 75.1
Women: 78.5
Men: 71.7
1990

Overall life expectancy: 75.4
Women: 78.8
Men: 71.8
1991

Overall life expectancy: 75.5
Women:78.9
Men: 72
1992

Overall life expectancy: 75.8
Women: 79.1
Men: 72.3
1993

Overall life expectancy: 75.5
Women:78.8
Men: 72.2
In 1993, the U.S. notched its first significant decline in life expectancy since 1980, a blip that experts attributed to several factors: AIDS, a deadly flu season, and high accidental-death and murder rates for the year.
1994

Overall life expectancy: 75.7
Women: 79
Men: 72.4
1995

Overall life expectancy: 75.8
Women: 78.9
Men: 72.5
1996

Overall life expectancy: 76.1
Women: 79.1
Men: 73.1
1997
Overall life expectancy: 76.5
Women:79.4
Men: 73.6
1998
Overall life expectancy: 76.7
Women: 79.5
Men: 73.8
1999

Overall life expectancy: 76.7
Women: 79.4
Men: 73.9
2000

Overall life expectancy: 76.8
Women: 79.7
Men: 74.3
2001

Overall life expectancy: 77
Women: 79.5
Men: 74.3
2002

Overall life expectancy: 77
Women: 79.6
Men: 74.4
2003

Overall life expectancy: 77.6
Women: 79.7
Men: 74.5
2004

Overall life expectancy: 77.5
Women: 80.1
Men: 75
2005

Overall life expectancy: 77.6
Women: 80.1
Men: 75
2006

Overall life expectancy: 77.8
Women: 80.3
Men: 75.2
2007

Overall life expectancy: 78.1
Women: 80.6
Men: 75.5
2008

Overall life expectancy: 78.2
Women: 80.6
Men: 75.6
2009

Overall life expectancy: 78.5
Women: 80.9
Men: 76
2010

Overall life expectancy: 78.7
Women: 81
Men: 76.2
2011

Overall life expectancy: 78.7
Women: 81.1
Men: 76.3
2012

Overall life expectancy: 78.8
Women:81.2
Men: 76.4
2013

Overall life expectancy: 78.8
Women: 81.2
Men: 76.4
2014

Overall life expectancy: 78.9
Women: 81.3
Men: 76.5
2015

Overall life expectancy: 78.7
Women: 81.1
Men: 76.3
In 2015, life expectancy fell from its 2014 peak of 78.9. Several factors were at play, researchers say, including an increasing number of midlife deaths from the opioid crisis.
2016

Overall life expectancy: 78.7
Women: 81.1
Men: 76.2
2017

Overall life expectancy: 78.6
Women: 81.1
Men: 76.1
2018

Overall life expectancy: 78.7
Women:81.2
Men: 76.2
2019

Overall life expectancy: 78.8
Women: 81.4
Men: 76.3
2020

Overall life expectancy: 77
Women: 79.9
Men: 74.2
The U.S. recorded a more than one-year drop in life expectancy after the coronavirus outbreak evolved into a pandemic in early 2020. Researchers express optimism that the number would rebound, but noted that deaths disproportionately affected communities of color.
2021

Overall life expectancy: 76.4
Women: 79.3
Men: 73.5
On average in 2021, life expectancy for men fell quicker than women, widening a gap that had been growing over the past decade. The CDC also noted that white people saw more deaths from COVID-19 in the second year of the pandemic than any other racial or ethnic group in the U.S. The increased mortality rate resulted in white people experiencing the second-biggest decline in life expectancy.
2022

Overall life expectancy: 77.5
Women: 80.2
Men: 74.8
In 2022, there was a slight increase in life expectancy for men and women, following a two-year decline. Heart disease and cancer remained the top two leading causes of death. However, unintentional injuries overtook COVID-19 as the third leading cause.
2023

Overall life expectancy: 78.4
Women: 81.1
Men: 75.8
See What Else Happened the Year You Were Born

H. Armstrong Roberts/Getty
- The Minimum Wage the Year You Were Born — A quick look at how the federal minimum wage has climbed from 25 cents in 1938 to today, showing what it was the year you were born.
- How Much a Dozen Eggs Cost the Year You Were Born — Using government data, we chart the price of eggs from 1940 through the late 1990s (adjusted for inflation) so you can see how much they cost when you were born.
- How Much a Ford Truck Cost the Year You Were Born — An overview of Ford F‑Series truck prices through the decades, including MSRP figures and inflation‑adjusted totals for each model year since 1948.