
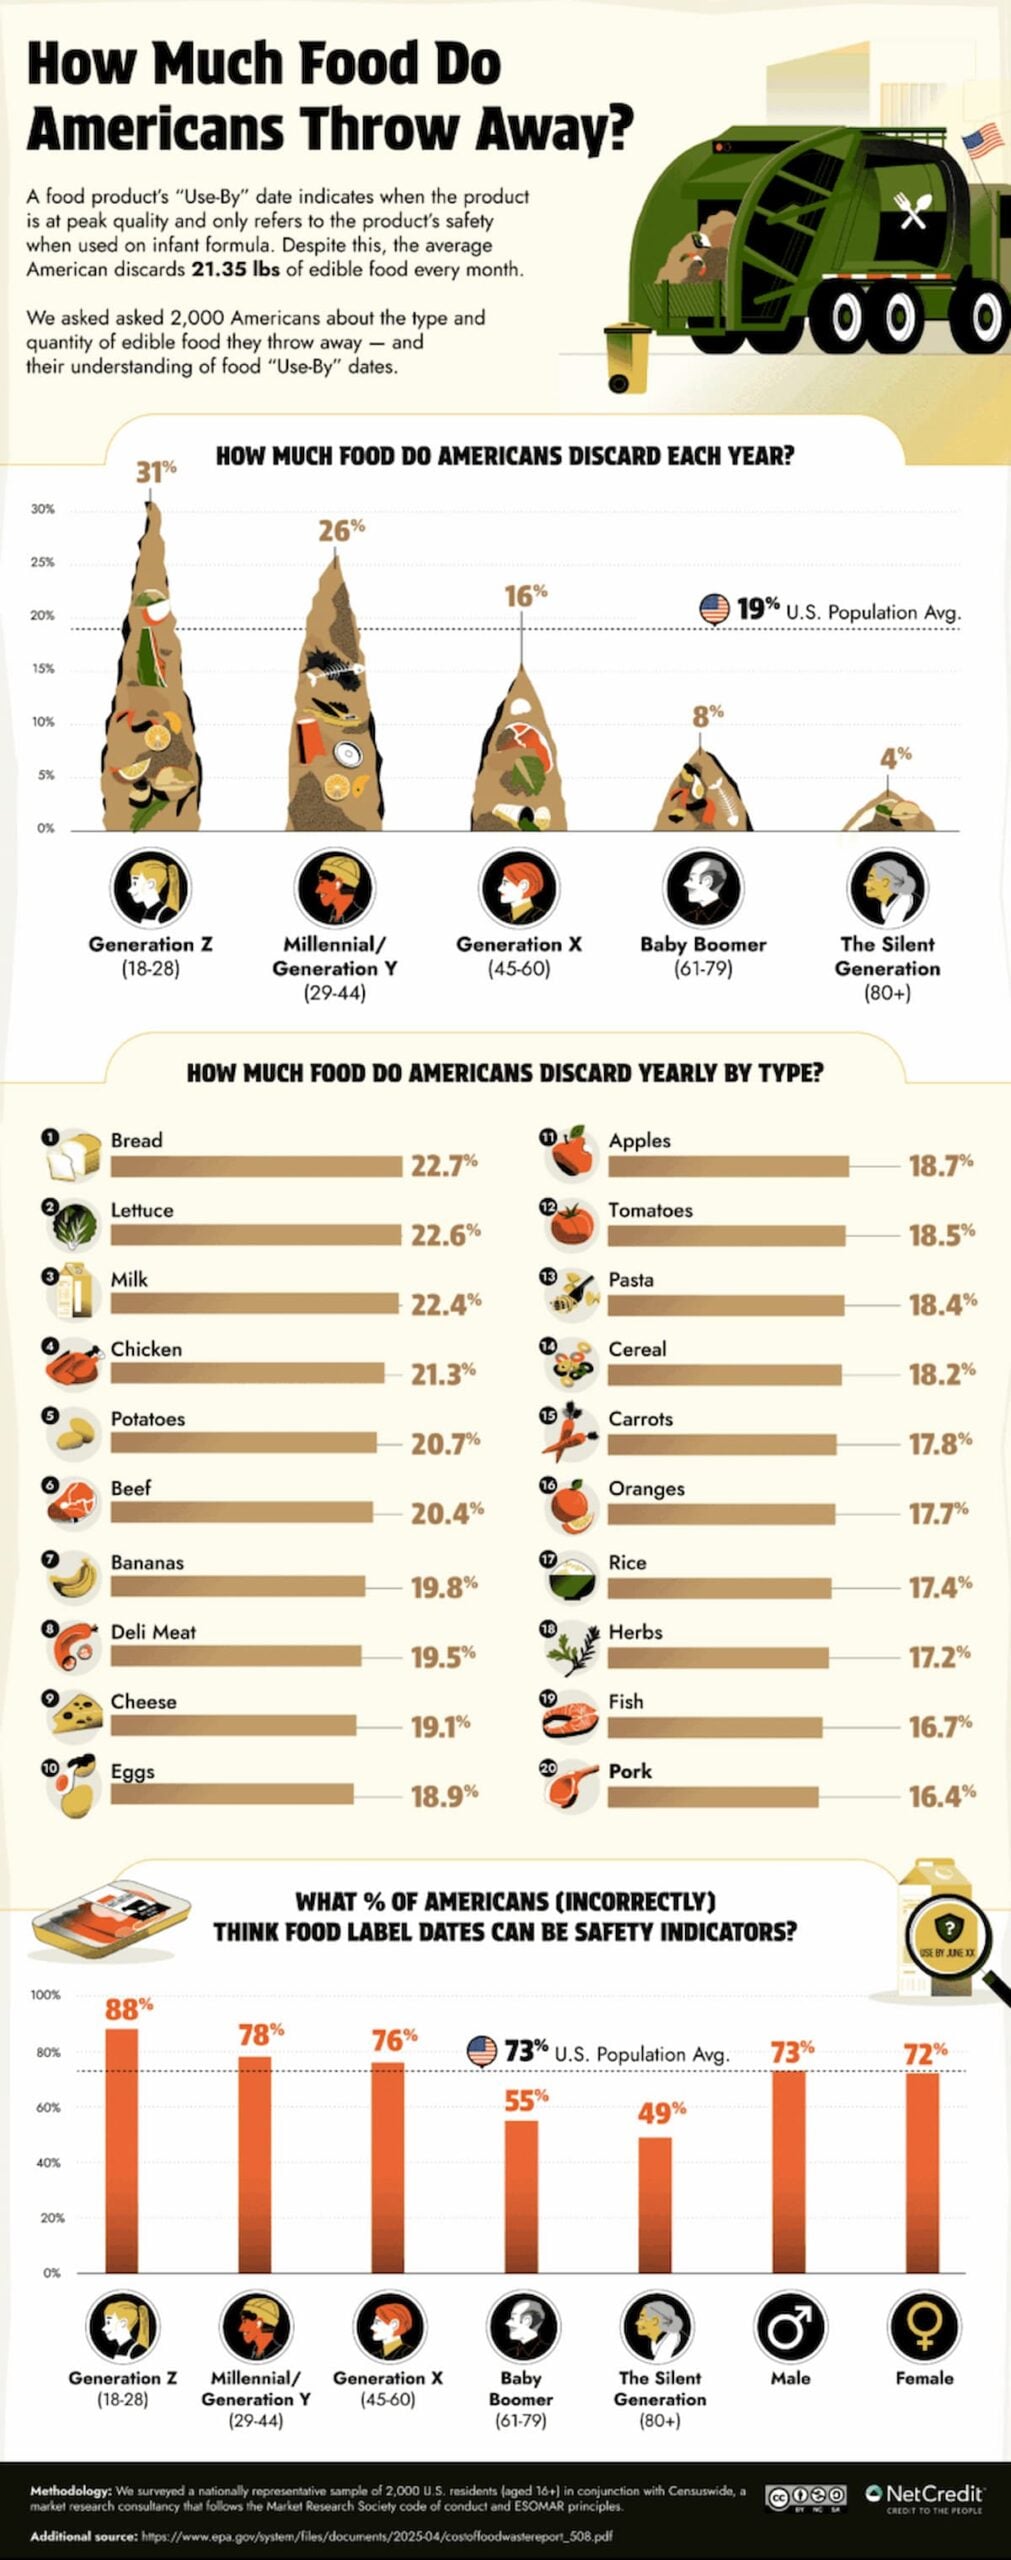
If it feels like your fridge is a graveyard of “I’ll eat this later,” you’re not alone — and you’re definitely not innocent. The average American throws out 21.35 pounds of edible food every month. Not scraps. Groceries. Full, usable groceries.
Food waste isn’t exactly a new problem, but the scale of it is still easy to underestimate. A recent analysis by NetCredit, using Environmental Protection Agency data alongside a survey of 2,000 Americans conducted with Censuswide, puts some concrete numbers behind what’s actually happening in U.S. kitchens — and it’s not small.
On average, Americans throw away $728 worth of food per year. Multiply that across households, cities, and states, and the totals quickly reach into the billions.
Who’s Throwing Away the Most Food?
The survey data shows a clear generational pattern, and for once, it’s not the Boomers taking the blame, but almost the opposite.
Generation Z reports throwing away 31% of the food they buy, the highest of any group. Millennials follow at 26%, while Generation X drops to 16%. Older Americans — Baby Boomers and the Silent Generation — report discarding less than 10%.
What Food Are We Tossing the Most?
Americans are throwing away the foods they buy — or more accurately, overbuy — every week, often without thinking twice about it. Bread leads the list, with 22.7% going uneaten, followed closely by lettuce (22.6%) and milk (22.4%). Chicken is the most commonly wasted meat at 21.3%, with everyday staples like potatoes, bananas, and deli meat not far behind.
Do Americans Misunderstand Food Labels?
One of the biggest drivers of food waste appears to be confusion over date labels. According to the survey, 73% of Americans believe food label dates indicate safety, whereas, most “best by” or “use by” dates are about peak quality, not whether food is safe to eat. The U.S. Department of Agriculture notes that, aside from infant formula, these dates are not federally regulated as safety cutoffs, and food can often still be consumed if it shows no signs of spoilage.
That misunderstanding likely contributes to otherwise edible food being thrown away prematurely.
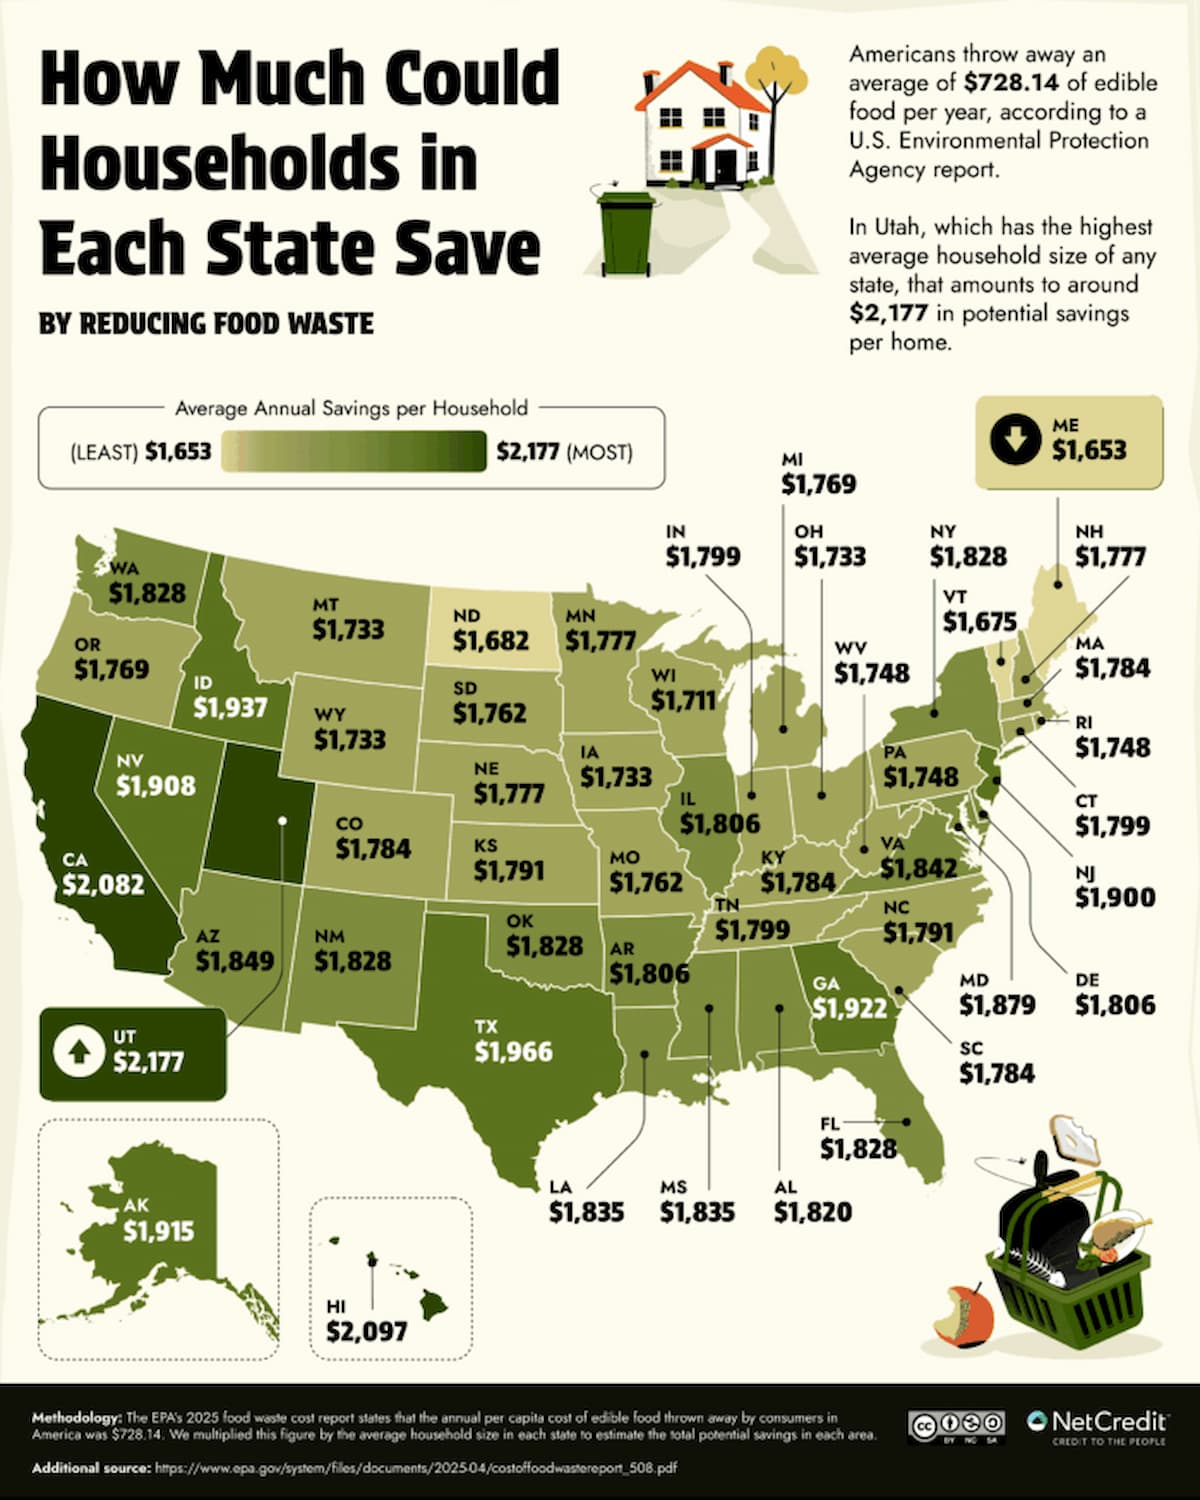
How Much Could Households Save?
Using the EPA’s estimate of $728 in annual food waste per person, the study calculates potential savings by household.
In Utah, where household sizes are larger on average, that translates to about $2,177 in potential savings per household each year. Other states fall slightly lower, but the pattern is consistent: larger households mean higher potential savings.
It’s worth noting that these figures don’t suggest certain states waste more than others — they reflect differences in population and household size, not behavior.
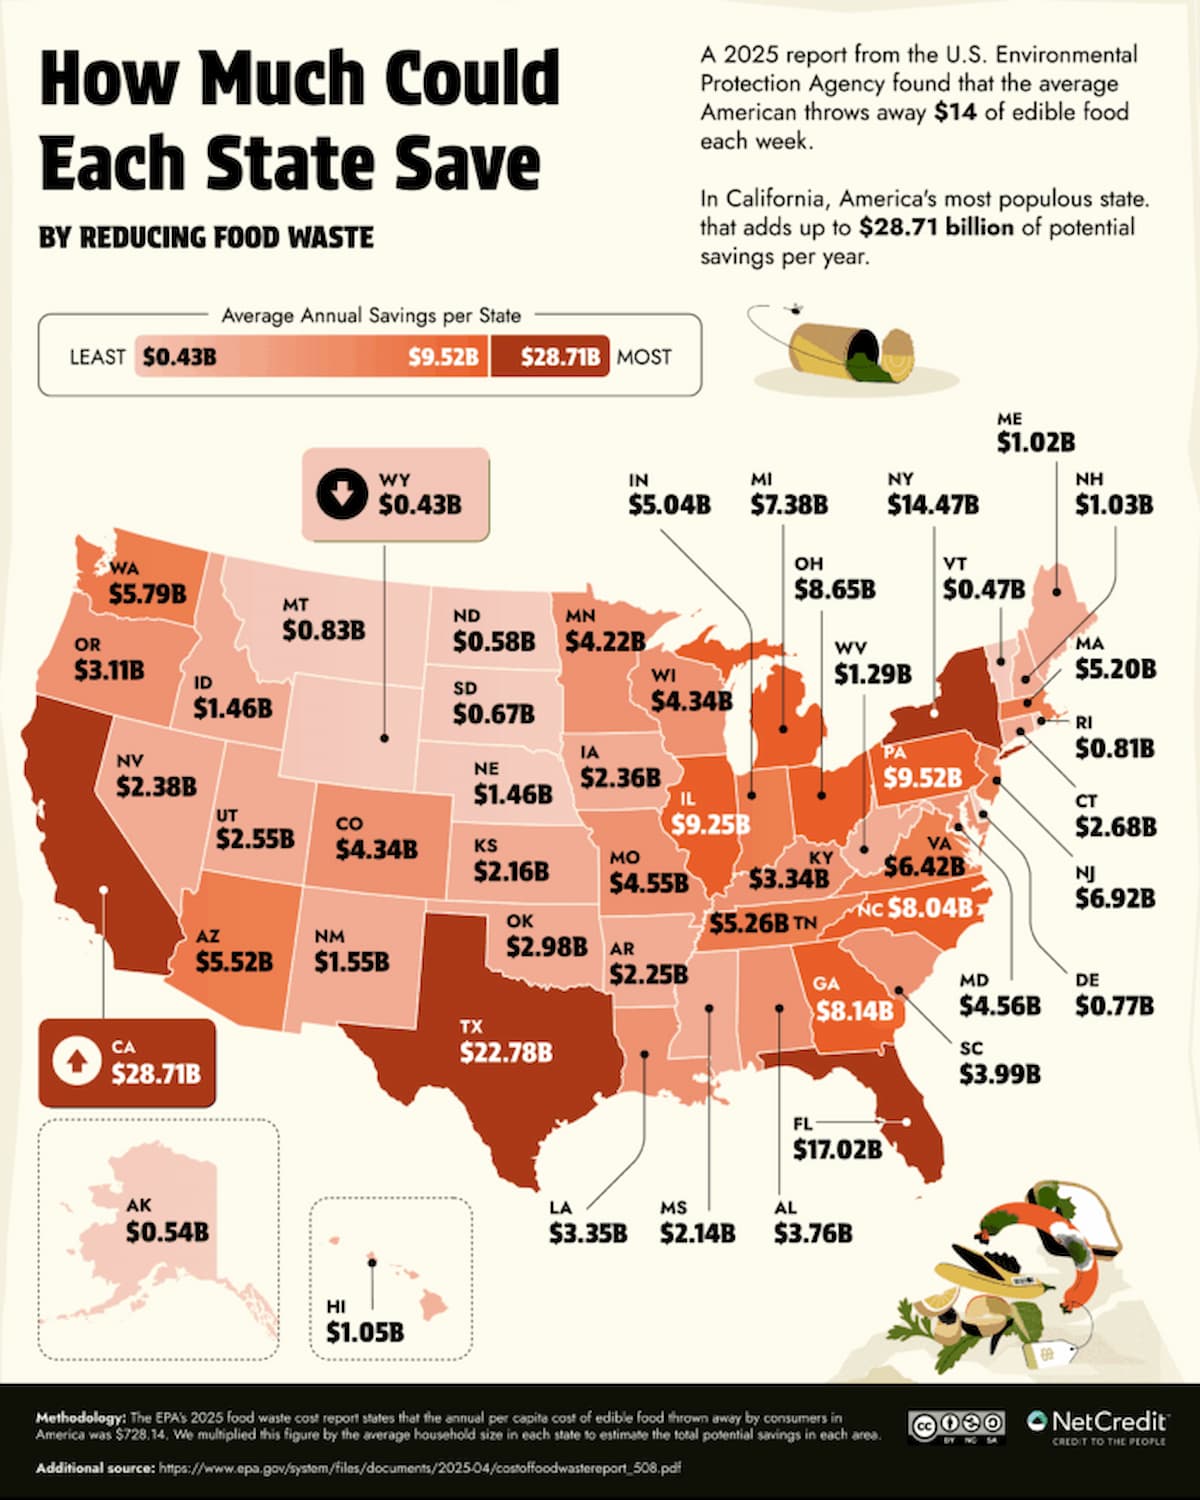
What About at the State Level?
When scaled across entire populations, the numbers become much larger.
California, as the most populous state, accounts for an estimated $28.71 billion in edible food waste annually. Texas follows at $22.78 billion, with Florida and New York also exceeding $14 billion each.
These totals are based on the assumption that food waste rates are relatively consistent nationwide, meaning they reflect scale rather than ranking.
Trending on Cheapism


Which Cities Stand Out?
At the city level, population density plays a similar role.
New York City leads with an estimated $6.17 billion in wasted food each year, followed by Los Angeles at $2.82 billion. Other major cities — including Houston, Chicago, and Phoenix — also reach into the hundreds of millions or billions.
More From Cheapism
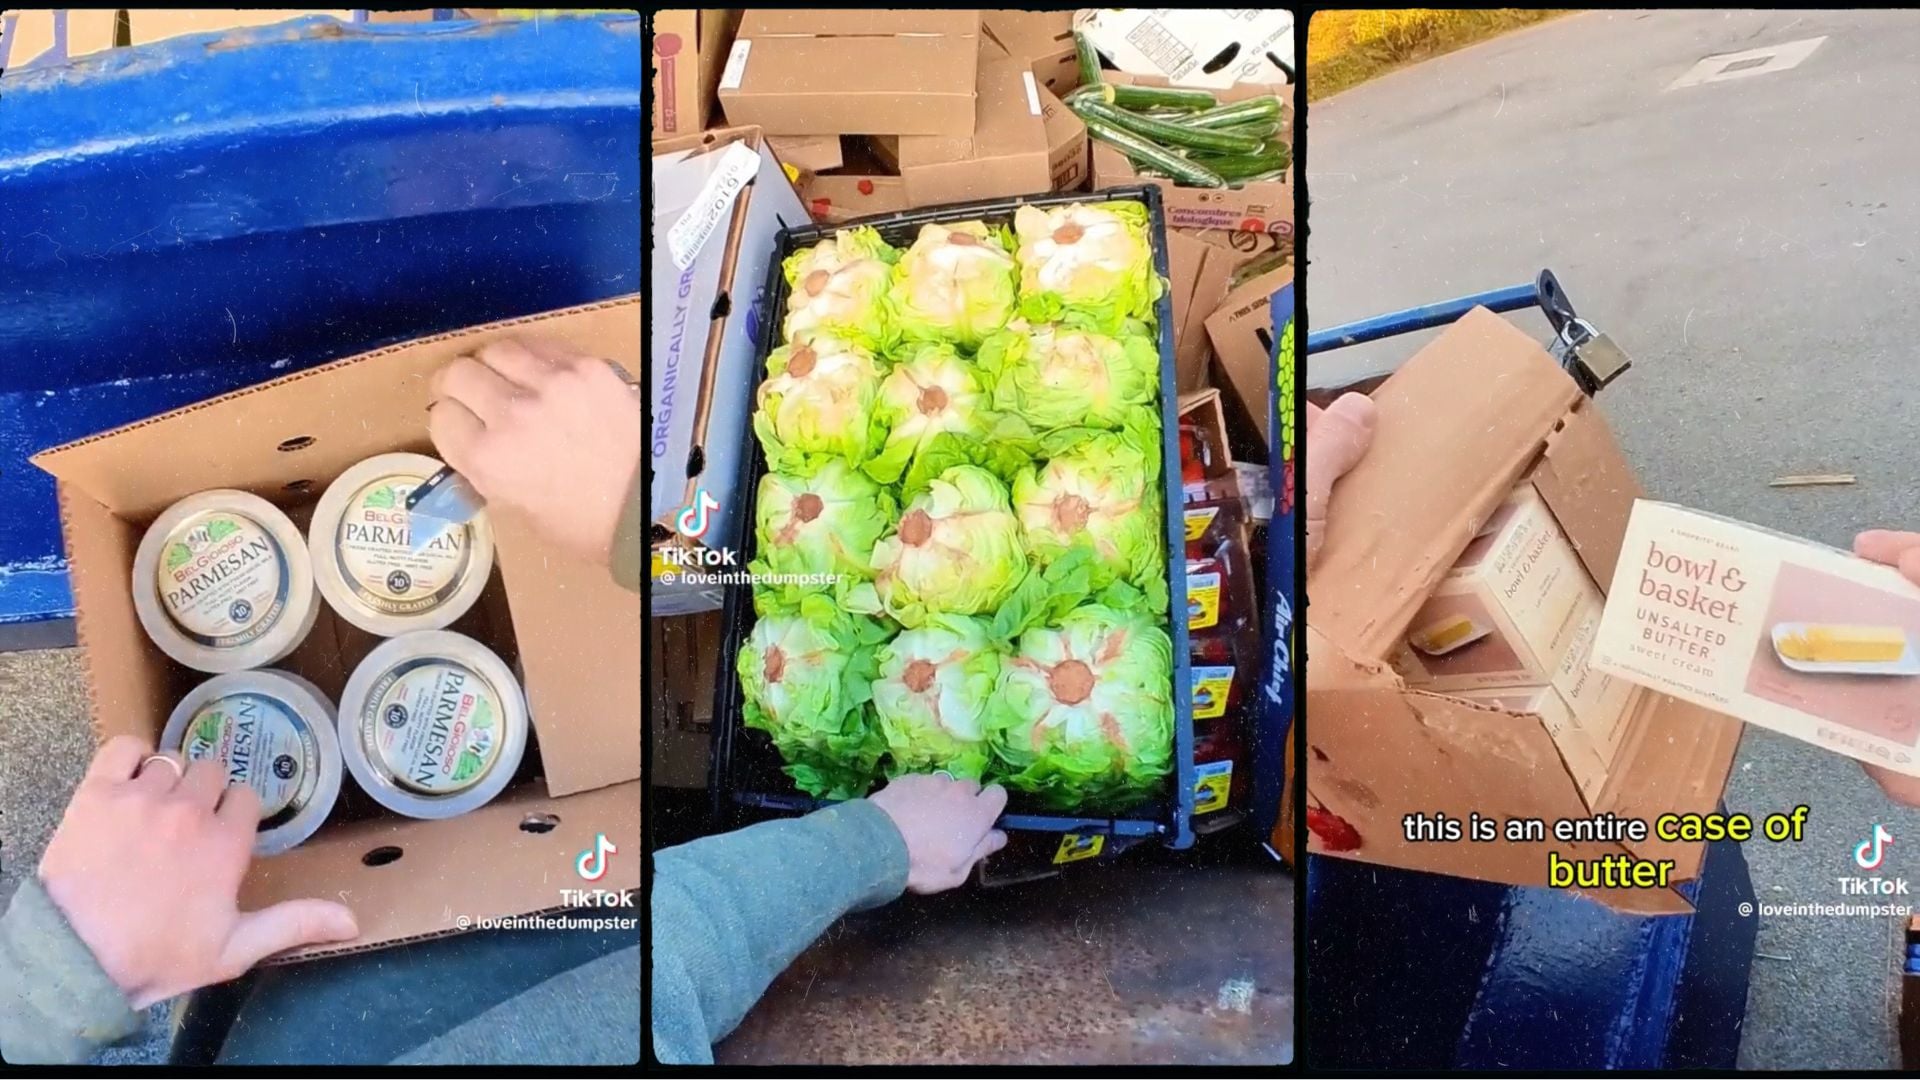
- Why Dumpster Diving Is Going Viral on TikTok and Reddit — Some Americans are skipping the front door of the grocery store and going straight to the dumpster. The practice, known as dumpster diving, it’s a viral trend.
- Reddit’s Dumpster Divers Reveal Their Incredible Finds — If you thought there couldn’t possibly be anything worthwhile in the trash, this will make you think again. Here are some of the unbelievable finds Redditors discovered in dumpsters.
- The Cheapest Grocery Stores in America — If you’re serious about stretching every dollar, these are the markets that make it possible to shop smart without compromising on quality.