Owning a car is a necessity for most Americans, but many are finding that rising costs are making it feel more like a luxury, according to a new survey by Lending Tree. That puts basic transportation in the same category as designer handbags and live-in nannies, and frankly, looking at our car loan and insurance payments, it’s hard to disagree.
‘Owning a Car Is a Luxury I Can’t Afford’
In the survey, 2,000 Americans were asked about car ownership and its affordability — or lack thereof. A whopping 39% of respondents said that owning a car is a luxury they can’t afford. The same percentage of people said car ownership is still reasonably affordable, making it seem like there’s a pretty big gulf in opinions.
Naturally, perspective shifts with income levels. Over half (51%) of respondents earning $100,000 or more said car ownership was reasonably affordable, while 50% of those earning $30,000 or less said they can’t personally afford a car.
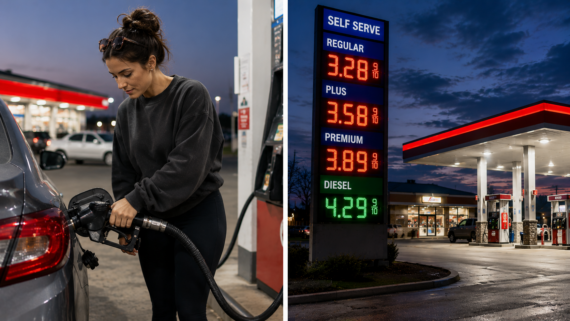
Rising loan payments, insurance, gas, and maintenance costs are all pushing cars into the luxury category. Car loan payments now cost an average of $7,275 annually. Auto insurance has risen 37.5% since 2021, costing an average of $2,277 every year, according to Lending Tree. New vehicle prices are up 12.4% and car maintenance is up 12% in the same time period. And we don’t have to tell you about gas prices; you see those astronomical increases every time you fill up.
All of that adds up to a luxury many people can’t afford.
States Where People Spend the Most on Cars
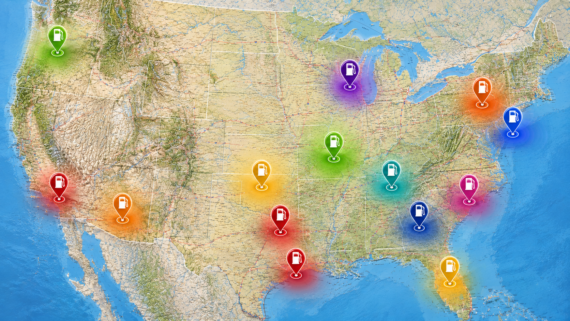
The cost of owning a car varies by state, as does average household income. In some states, car ownership has reached a tipping point where people with active auto loans spend 15% or more of household income on car-related expenses. That’s considered being transportation cost burdened by the U.S. Department of Transportation.
Here are the top 10 states where car ownership costs take up the biggest share of average household income.
- Louisiana
Total car costs: $14,894
Percentage of household income: 23.2% - Mississippi
Total car costs: $13,378
Percentage of household income: 21.5% - New Mexico
Total car costs: $14,115
Percentage of household income: 19.8% - Arkansas
Total car costs: $12,798
Percentage of household income: 19.6% - Alabama
Total car costs: $13,164
Percentage of household income: 18.8% - West Virginia
Total car costs: $11,951
Percentage of household income: 18.7% - Kentucky
Total car costs: $12,628
Percentage of household income: 18.6% - Oklahoma
Total car costs: $12,722
Percentage of household income: 18.3% - Florida
Total car costs: $14,546
Percentage of household income: 17.8% - Missouri
Total car costs: $13,235
Percentage of household income: 17.6%
On the flipside, car owners in Massachusetts spend the least percentage of their income on car costs. They only pay an average of $11,745 in total costs annually, which is 10.6% of the average household income.
More From Cheapism
- What to Know Before Buying a ‘Cheap’ Car — When it comes to “cheap” cars, the sticker price rarely tells the whole story. What looks like a bargain upfront can quickly turn into a series of unexpected expenses, from repairs to higher operating costs.
- Inflation Hits Highest Level in 3 Years as Energy and Food Prices Rise — Listen, folks, the reality on the ground is simple: We’re being squeezed. Between a war that’s sent energy prices into the stratosphere and supply chains that are about as reliable as a chocolate teapot, the affordability crisis is pretty much our way of life now.
- These 10 Car Brands Are the Cheapest to Maintain, According to Consumer Reports — A recent study from Consumer Reports surveyed car owners about how much they’ve spent to maintain their cars. There’s a big difference in cost between brands, both within the first five years of purchasing a new car and over a period of 10 years.